
Figure 3.
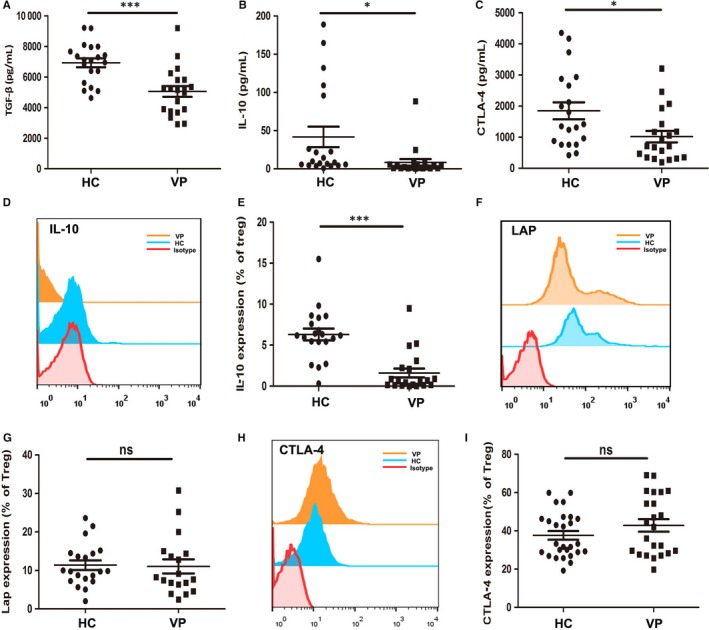
The concentrations of cytokines contributing to the plasticity of Treg cells in serum and their expression level in Treg cells. (A‐C) Elisa assay for serum levels of TGF‐β, IL‐10 and sCTLA‐4 of healthy controls and vitiligo patients (n = 20). (D and E) Flow cytometry detection of IL‐10 expression in Tregs of healthy controls and vitiligo patients (n = 20). (F and G) Flow cytometry detection of LAP expression in Tregs of healthy controls and vitiligo patients (n = 20). (H and I) Flow cytometry detection of CTLA‐4 expression in Tregs of healthy controls and vitiligo patients (n = 20). Values are presented as the mean ± SD, *P < .05, ***P < .001, ns, not significant. HC, healthy controls; VP, vitiligo patients