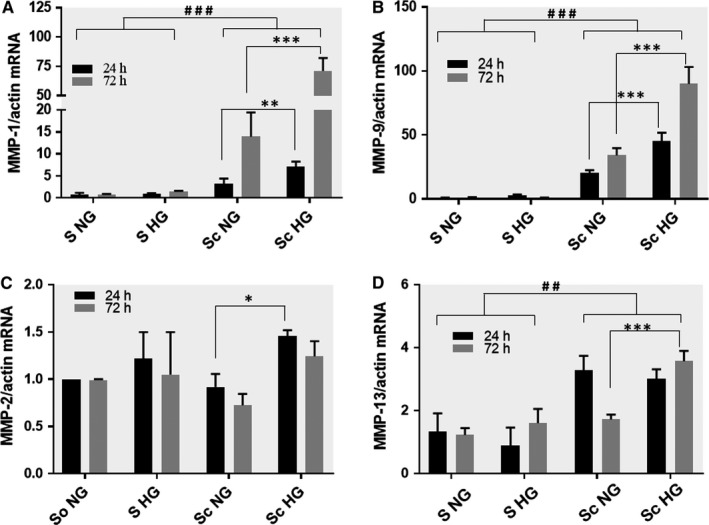
Figure 1.

Gene expression of MMP‐1 (A), MMP‐9 (B), MMP‐2 (C) and MMP‐13 (D) in smooth muscle cells (SMC) subsequent to their co‐culture with macrophages (MAC) in normal and high‐glucose conditions. After 24 or 72 h, mRNA was obtained from cell homogenates and subjected to RT‐PCR. The mRNA of MMPs were normalized to actin mRNA. S NG, control SMC grown in normal glucose (5 mmol/L) concentration; S HG – SMC exposed to high (25 mmol/L) glucose concentration in the culture medium; Sc NG ‐ SMC after their co‐culture with MAC in normal glucose, Sc HG ‐ SMC after their co‐culture with MAC in high glucose conditions. Note the significant increase of MMP‐1 and MMP‐9 gene expression in SMC after their co‐culture with MAC in HG conditions compared to SMC co‐cultured with MAC in normal glucose or controls (SMC not co‐cultured, exposed to NG or HG conditions) at both, 24 or 72 h. n = 4, *P < .05, **P < .01, ***P < .001, ## P < .01, ### P < .001
