
Figure 6.
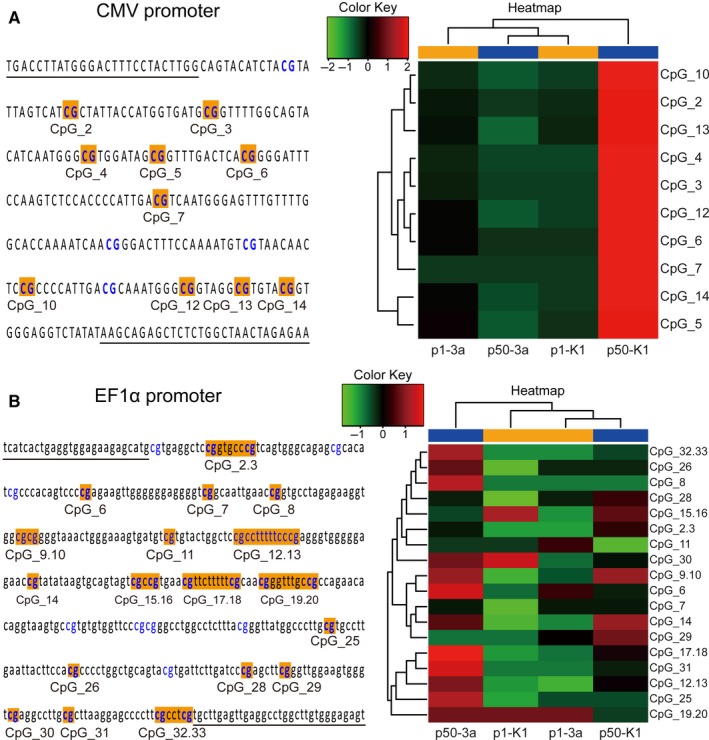
CpG sites in the amplicon and the hierarchical cluster analysis of methylation patterns of the CMV (A) or EF1α (B) regions in the stably transfected Dnmt3a‐deficient 3a‐30 (3a) and control CHO‐K1 (K1) cells at the start (p1) and 50 passages (p50)