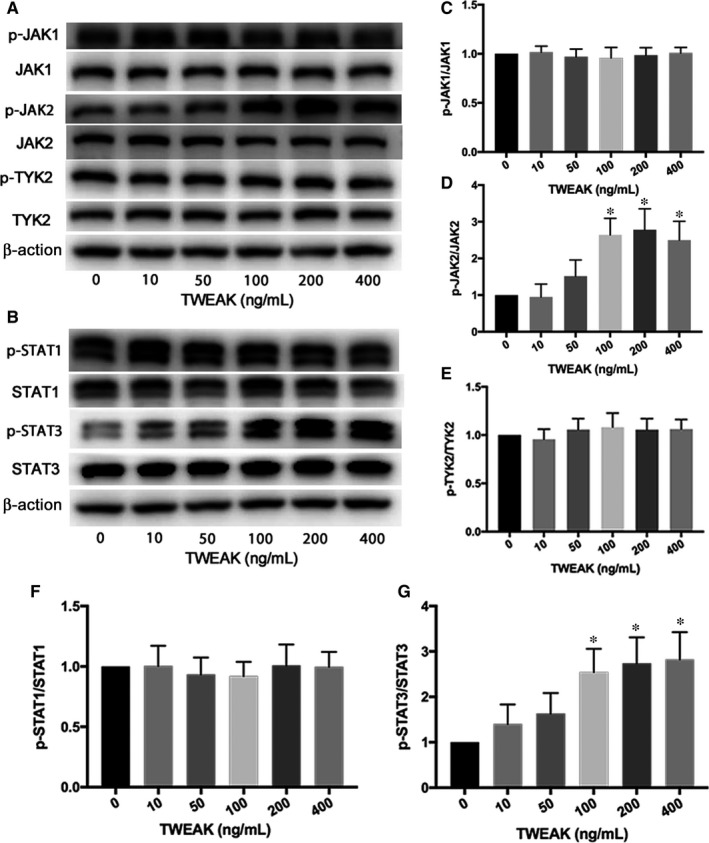
Figure 5.

TWEAK increased p‐JAK2 and p‐STAT3 expression in HL‐1 atrial myocytes. A, B, Western blot analysis of p‐JAK1, p‐JAK2, p‐TYK2 and p‐STAT1, p‐STAT3 protein expression after TWEAK stimulation at different concentrations. C‐G, Quantitative analysis of A, B. *P < .05 compared with control
