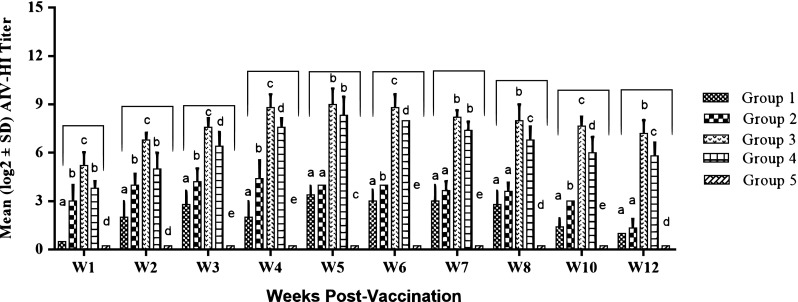
Fig. 2.

Serum AIV antibody titers post vaccination. Antibody titers were evaluated by hemagglutination inhibition (HI) assay. Plot represents the mean log2 antibody titer obtained at various weeks post vaccination. Different letters within the same week are significantly different at p value (≤ 0.05)
