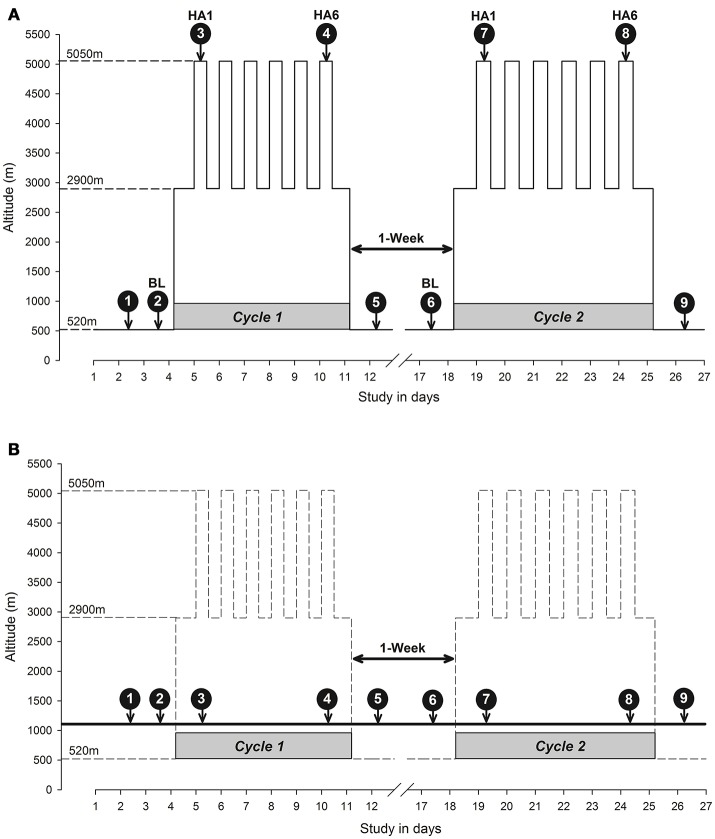
Figure 2.
Study design diagram: Altitude vs. Control. (A) Altitude study protocol in which study participants were exposed to altitude at ALMA; (B) Control study protocol in which data were collected in Calgary. The y-axis depicts altitude in meters and the x-axis depicts the study time in days. The dashed lines connecting to the y-axis indicates altitude as baseline altitude (Santiago, 520 m), sleeping altitude (ALMA Operations Support Facility Center, 2,900 m) and high altitude working station (ALMA, 5,050 m). The downward arrows indicate the nine cognitive function testing sessions over 26 days at corresponding altitude in y-axis and expedition days in x-axis during two cycles of high altitude expedition interspersed with a week of resting at low altitude. The average altitude exposure at ALMA Observatory work station during each day was ~4–8 hrs/day. The remainder of the time was spent at the ALMA base camp of an altitude of 2,900 m to sleep. In the control protocol (B), the high-altitude cycle (expedition) has been depicted as dashed lines but experimental altitude (Calgary, 1,103 m asl) has been depicted as a bold solid line crossing the two cycles with data collection time points (white numbers inside black filled circles with arrows going down to respective days matching high altitude protocol similar to A). The solid line with arrows on both sides between two cycles (1-Week) indicates 7 days rest a low altitude separating two cycles in both panels. BL, baseline; HA1, high altitude acute exposure at day 1; HA6, high altitude acclimatization exposure at day 6; 1-Week, one week break between two cycles of expedition in (A) and data collection in (B).

