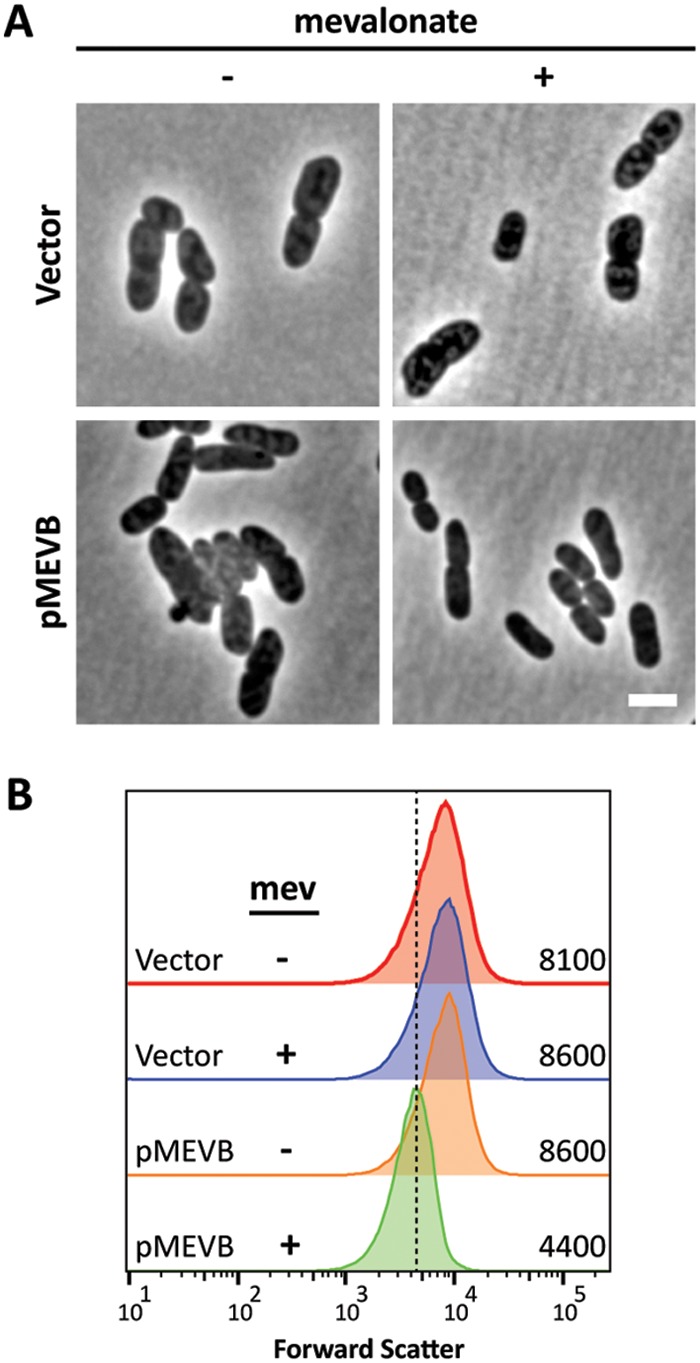
FIG 6.

Increased levels of IPP restore cell shape to MG1655 uppS31 ispH269 (SKMG198) (A) Cells were grown at 42°C in LB to an OD600 of 0.4 to 0.5 with (+) or without (−) 2.5 mM mevalonate and photographed by phase-contrast microscopy. The scale bar represents 3 μm. (B) Histograms of the forward-scatter area of 100,000 live cells, as shown in panel A. The mean of the forward-scatter area is reported in arbitrary units to the right of each curve, and the vertical dashed line represents the mean forward scatter of the parent. Vector, pBBR1MC-3; pMEVB, pMEVB.
