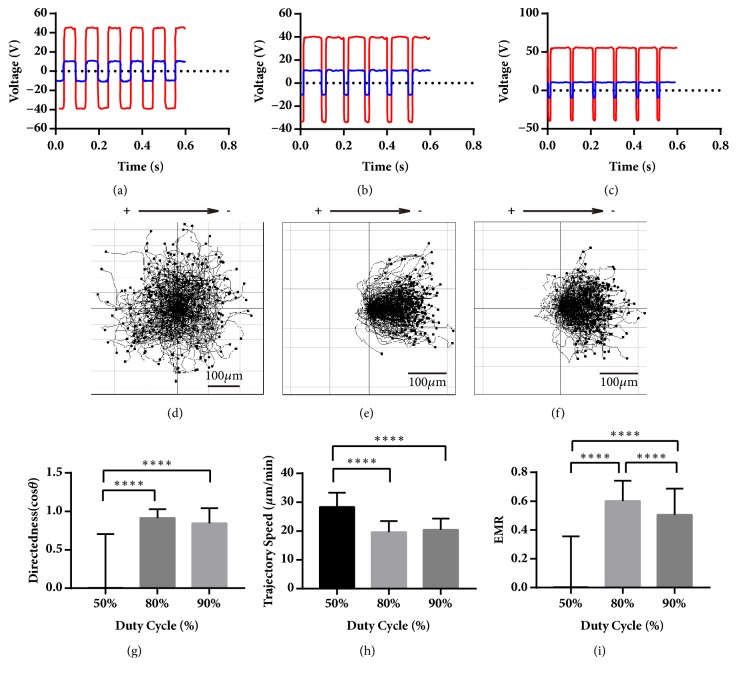
Figure 6.
The waveforms of the chamber and the stimulator, the collective galvanotaxis trajectory, and the analysis of the directedness, trajectory speed, and EMR in 10 Hz bpEFs with duty cycle of 50%, 80%, and 90%. (a-c) The waveforms of the chamber (blue) and the stimulator (red) in 10 Hz 50% duty cycle bpEF, 10 Hz 80% bpEF, and 10 Hz 90% bpEF. (d) The galvanotactic trajectory of all 240 cells under 10 Hz 50% bpEF showed that they migrated randomly. (e-f) The galvanotactic trajectory of all 240 cells under 10 Hz bpEF with duty cycle of 80% (e) and 90% (f) showed that they migrated towards the “net cathodes”. (g) The cells under 10 Hz 50% bpEF were distinct from those under 80% and 90% in directedness. ANOVA on different duty cycle: ∗∗∗∗ p < 0.0001. For multiple comparisons, 50% versus 80%: ∗∗∗∗ p < 0.0001; 50% versus 90%: ∗∗∗∗ p < 0.0001. (h) The cells under 10 Hz 50% bpEF migrated the fastest. ANOVA on different duty cycle: ∗∗∗∗ p < 0.0001. For multiple comparisons, 50% versus 80%: ∗∗∗∗ p < 0.0001; 50% versus 90%: ∗∗∗∗ p < 0.0001. (i) The cells under 10 Hz 80% bpEF were the highest in EMR. ANOVA on different duty cycle: ∗∗∗∗ p < 0.0001. For multiple comparisons, 50% versus 80%: ∗∗∗∗ p < 0.0001; 50% versus 90%: ∗∗∗∗ p < 0.0001; 80% versus 90%: ∗∗∗∗ p < 0.0001. One-way ANOVA and Tukey's test of multiple comparisons were used.

