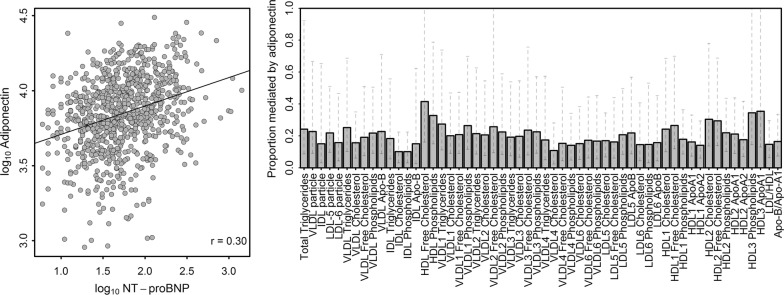
Fig. 4.
Left: Scatterplot of serum N-terminal prohormone of brain natriuretic peptide (NT-proBNP) and adiponectin concentrations on a logarithmized scale. The black line indicates a simple linear regression fit. Right: Proportion mediated (bars) with 95% confidence intervals by serum adiponectin concentrations for lipoprotein subclass measures significantly associated with serum NT-proBNP in linear regression analyses

