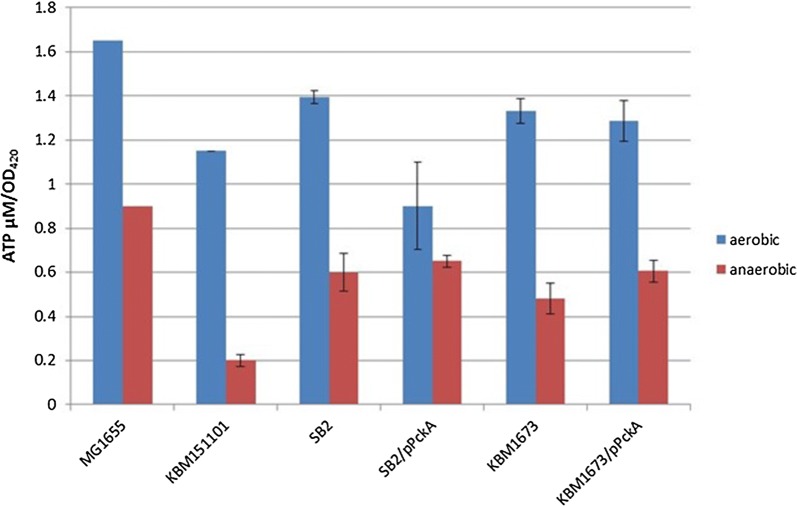
Fig. 3.
Measurement of ATP level of strains MG1655 and mutants. Shown are the concentrations of intracellular ATP in the different strains during the aerobic (blue) and anaerobic (red) phase of two-stage cultivations. Samples were taken during the exponential phase of aerobic growth and after 4 h in the anaerobic phase. Data are derived from two independent experiments with exception of MG1655 with only one repeat

