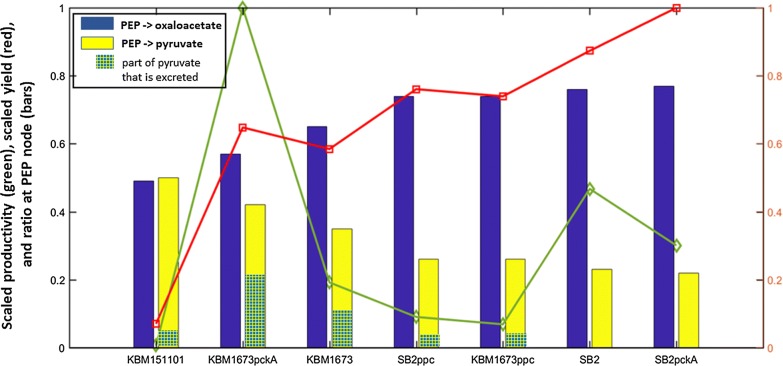
Fig. 5.
Flux ratio at node PEP. Bars show the relative flux from PEP to oxaloacetate (blue bars) and pyruvate (yellow bars) as determined by FBA; the hatched green part in the yellow bars indicate the fraction of the flux to pyruvate that is excreted into the medium as given by the measurement of extracellular pyruvate. Superimposed are shown the succinate yield (relative to the maximal yield obtained in this study) (red curve) and productivity (relative to the maximal productivity obtained in this study) (green curve)

