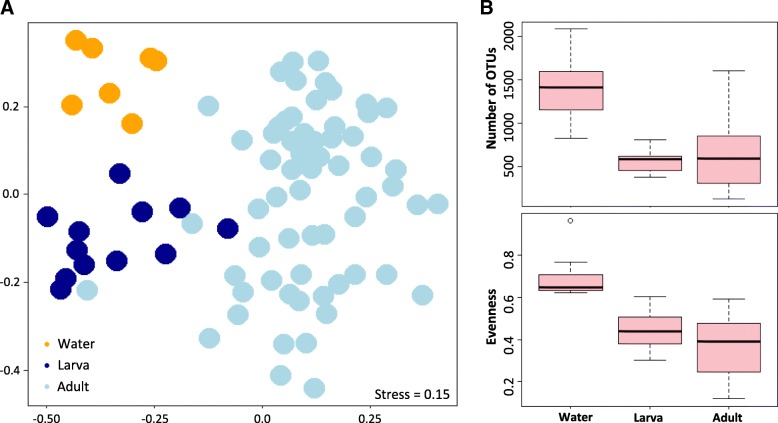
Fig. 1.
a Non-metric multidimensional scaling ordination—NMDS—showing that bacterial communities cluster by sample type using Bray-Curtis dissimilarity distance (see Shepard stress diagram in Additional file 1D). Each dot represents an individual collection of either a water sample, a larva, or an adult gut. b Boxplots representing the observed number of bacterial operational taxonomic units (OTUs) and OTUs evenness by sample type

