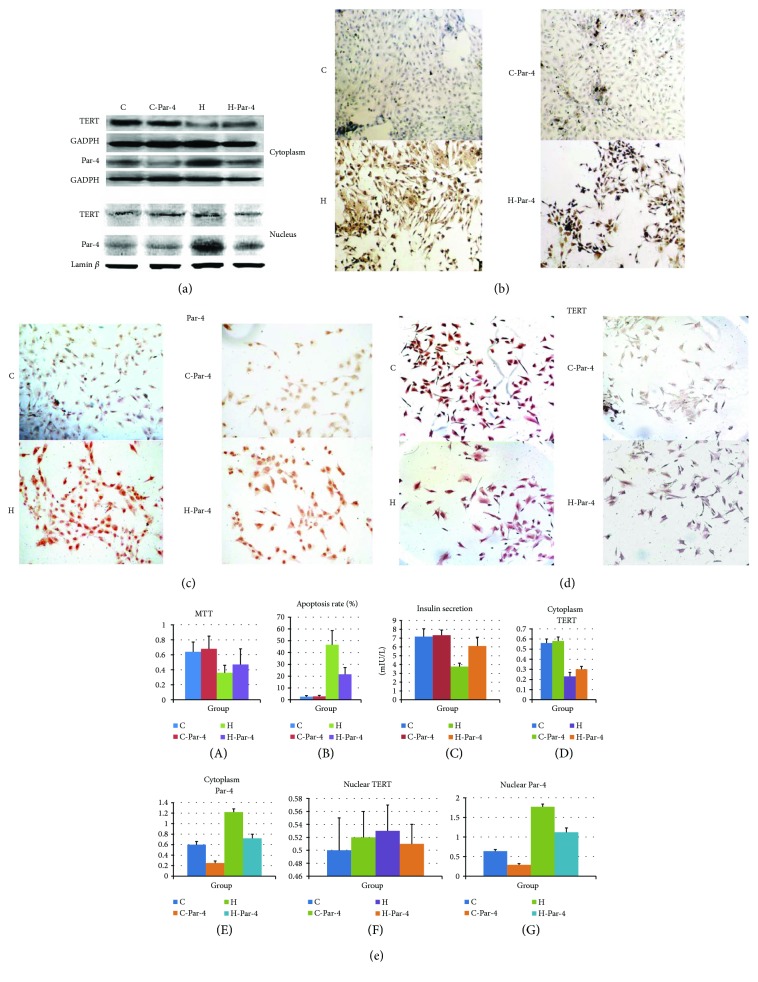
Figure 3.
Subcellular localization of Par-4 and TERT in diabetes. (a) Western blot analysis of Par-4 and TERT expression in cytoplasmic and nuclear extracts in each group. (b) Apoptosis was detected via TUNEL staining in each group. (c) Immunocytochemistry analysis of Par-4 expression in each group. (d) Immunocytochemistry analysis of TERT expression in each group. (e) Expression of Par-4 and TERT, apoptosis rates, cell survival rates determined with MTT assays, and glucose-stimulated insulin secretion in each group. ∗Compared with the C group, P < 0.05. #Compared with the H group, P < 0.05.

