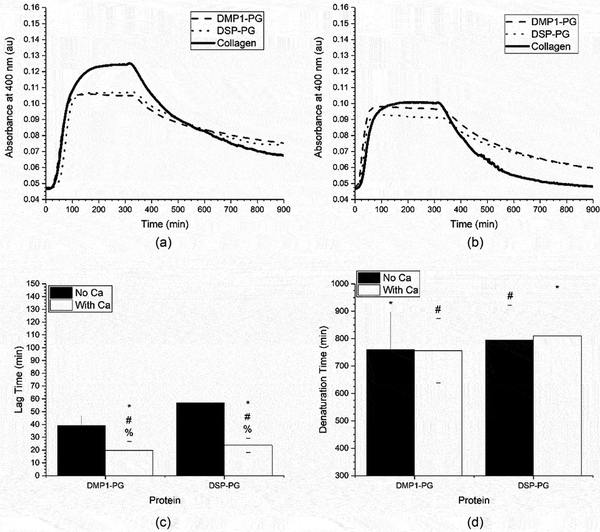
Figure 5:
Mean of the collagen fibrillogenesis and denaturation assays performed with proteoglycan proteins and 0.05 mg/ml of collagen (1:8 SIBLING to collagen ratio) in a) regular buffer and b) calcium supplemented buffer. For reference, the collagen control curves have been replicated from Figure 4. These curves have been analyzed to obtain the mean ± standard deviation of the c) fibrillogenesis lag time and d) denaturation lag time for proteoglycan proteins and 0.05 mg/ml of collagen (1:8 SIBLING to collagen ratio) in regular or calcium supplemented buffer (n=18). A * represents a statistically significant difference between collagen and the indicated SIBLING proteins, a # represents a statistically significant difference between the indicated proteoglycan protein and its native form, and a % represents a statistically significant difference between collagen and the regular and calcium supplemented buffer for the indicated SIBLING protein, all at a 95% confidence interval (p<0.05).

