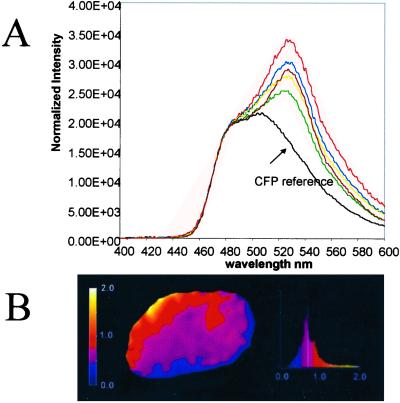
Figure 4.
FRET analysis on single nuclei of cotransfected COS cells. (A) Normalized emission spectra of single nuclei of five different cells (each color represents a single nucleus) 1 day after electroporation. The CFP reference spectrum (of single transfected MAD2B-CFP cells) is indicated. Sensitized emission can be observed in all nuclei examined at 525 nm. (B) Ratio image of free donor fluorescence (MAD2B) and total acceptor fluorescence (PRCC) 1 day after electroporation and intensity distribution histogram of the ratio image (mean 0.68). The change in color represents a change in ratio (0.0–2.0), as indicated in the bar along the intensity distribution diagram.

