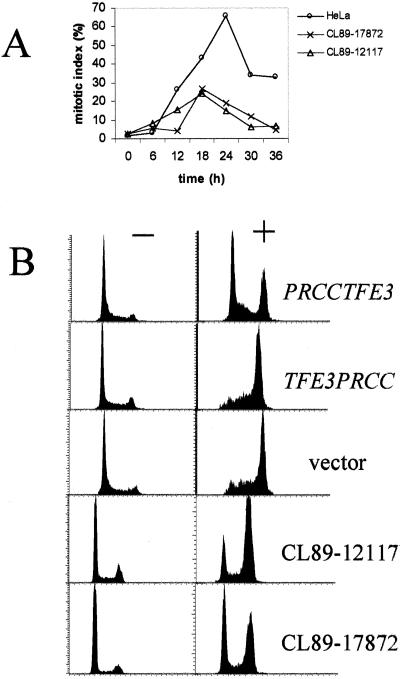
Figure 5.
Nocodazole treatment of t(X;1)-positive RCC and PRCCTFE3-transfected T-REx-293 cells. (A) Nocodazole assay of t(X;1)-positive RCC and HeLa cells. The mitotic index is given as the percentage of mitotic nuclei per 250–300 counted nuclei. (B) FACS analysis showing the result of nocodazole treatment of T-REx-293 cells transfected with PRCCTFE3, TFE3PRCC or empty vector negative controls (pcDNA/TO/myc-His), and t(X;1)-positive RCC CL89–12117 and CL89–17872 cells. The count of cells in arbitrary units is plotted as a function of the DNA content. Nocodazole treated cells are marked by +, nontreated cells by −.

