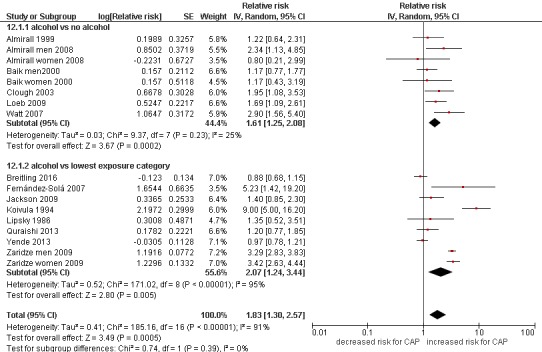
Figure 2.

Forest plot of alcohol consumption and risk of community-acquired pneumonia (CAP): subgroup analysis based on reference group (never drinking vs lowest drinking category).

Forest plot of alcohol consumption and risk of community-acquired pneumonia (CAP): subgroup analysis based on reference group (never drinking vs lowest drinking category).