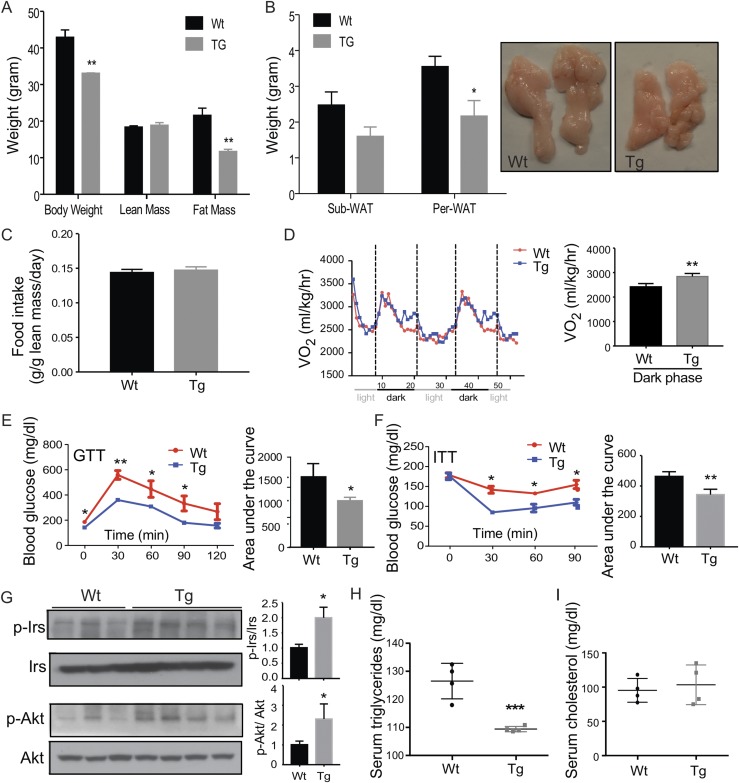
Figure 5.
Adipose overexpression of STS improves metabolic functions in HFD-fed females. All mice are females. Mice were fed with HFD for 20 weeks before analysis. Mice were analyzed for (A) body weight and body composition, (B) fat mass, (C) food intake, (D) oxygen consumption, (E) GTT, and (F) ITT. The quantifications of the GTT and ITT results are shown as the areas under the curve. (G) Western blot analysis of Irs-1 and Akt phosphorylation in epi-WAT. Shown on the right are the densitometric quantifications of the Western blotting results. The serum levels of (H) triglycerides and (I) cholesterol. Results are expressed as mean ± SD; n = 4 mice per group. *P < 0.05; **P < 0.01, compared with the Wt. sub-WAT, subcutaneous WAT.

