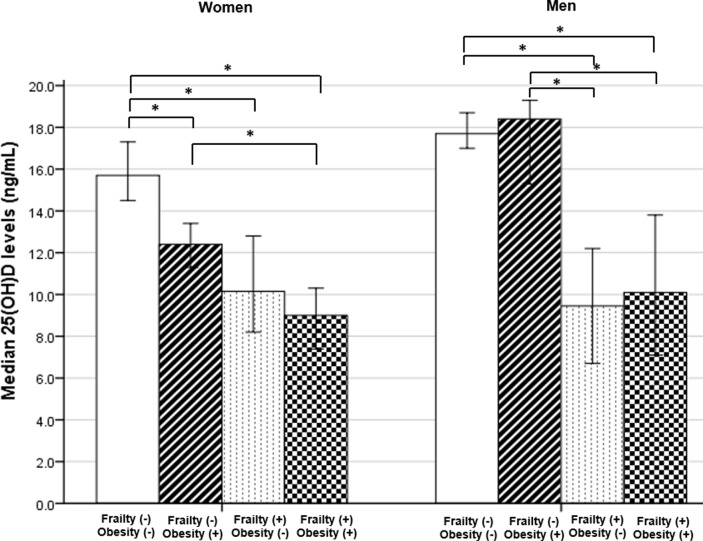
Fig 1. Differences in median (95% CI) 25(OH)D serum levels between Obesity(-) Frailty(-) (W: n = 359; M: n = 364), Obesity(+) Frailty(-) (W: n = 263; M: n = 151), Obesity(-) Frailty(+) (W: n = 102; M: n = 56) and Obesity(+) Frailty(+) (W: n = 113; M: n = 39) groups, in older women (W) and men (M), using Kruskal-Wallis with Dunn-Bonferroni tests for multiple comparisons.
*p<0.05 for pairwise comparisons.

