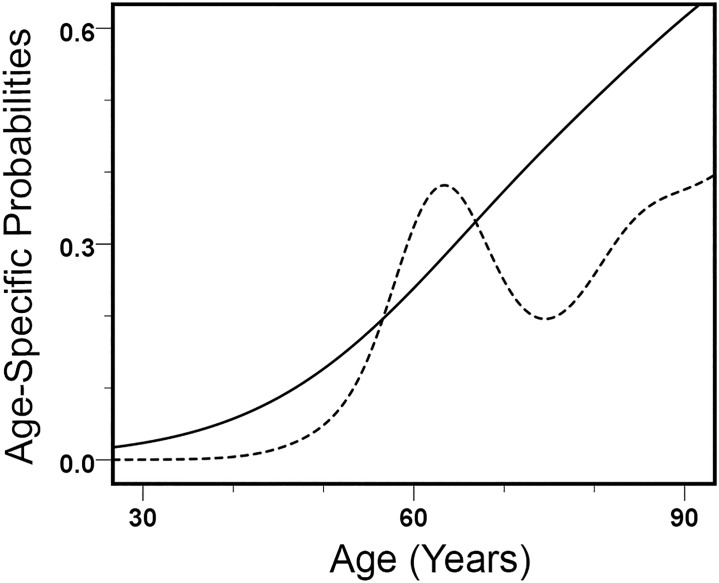
Fig 2. Probability curves for females and males with DISH.
Female (dotted) and male (solid) probability curves for individuals with DISH, estimated from an American mortality sample through empirical smoothing. Male frequencies increase with advancing age. The female curve, with a peak around 60 years, indicates that women with early-onset DISH experience a relatively high risk of dying around that age.

