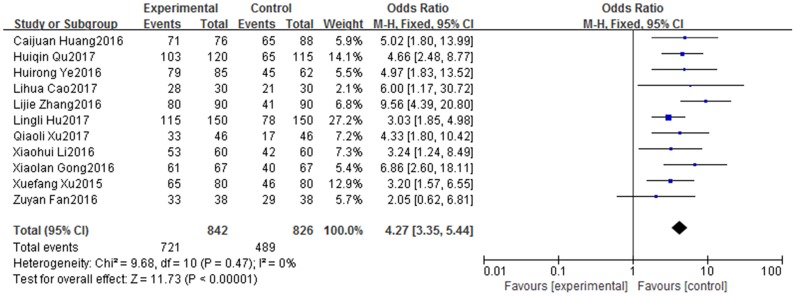
Fig 5. Forest plot diagram showing maintenance dependency of patients with PICC after discharge in WeChat group and traditional group.
Each square indicates a study, and the area of squares is proportional to the weight of the study. The diamond represents the summary OR and 95% CI. CI = confidence interval, OR = odds ratio.

