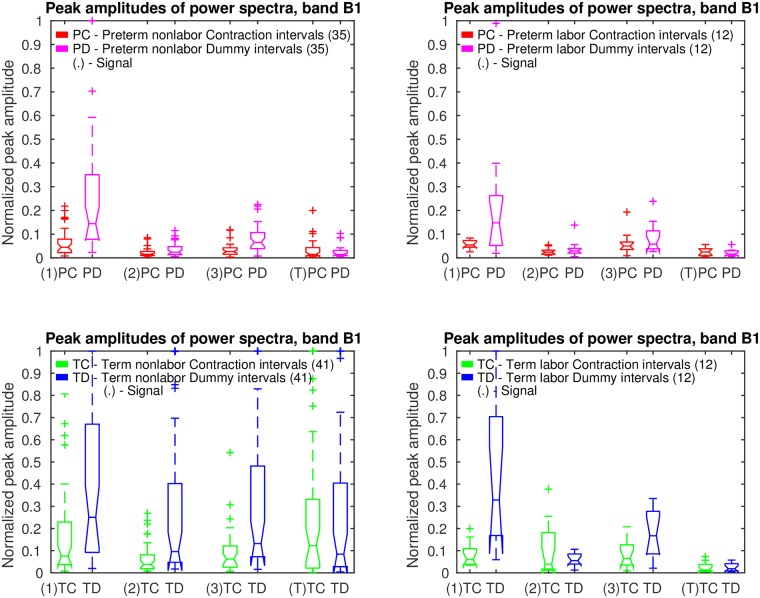
Fig 13. Box plots of normalized peak amplitudes, PA, in the frequency band B1 of signals S1, S2, S3, and TOCO, for preterm and term, nonlabor and labor, groups of contraction and dummy intervals.
The line in the middle of each box is the sample median. The tops and bottoms of each box are the 25th and 75th percentiles of the samples. The wiskers represent the 10th and 90th percentiles. Crosses are outliers. Notches display the variability of the median between samples.

