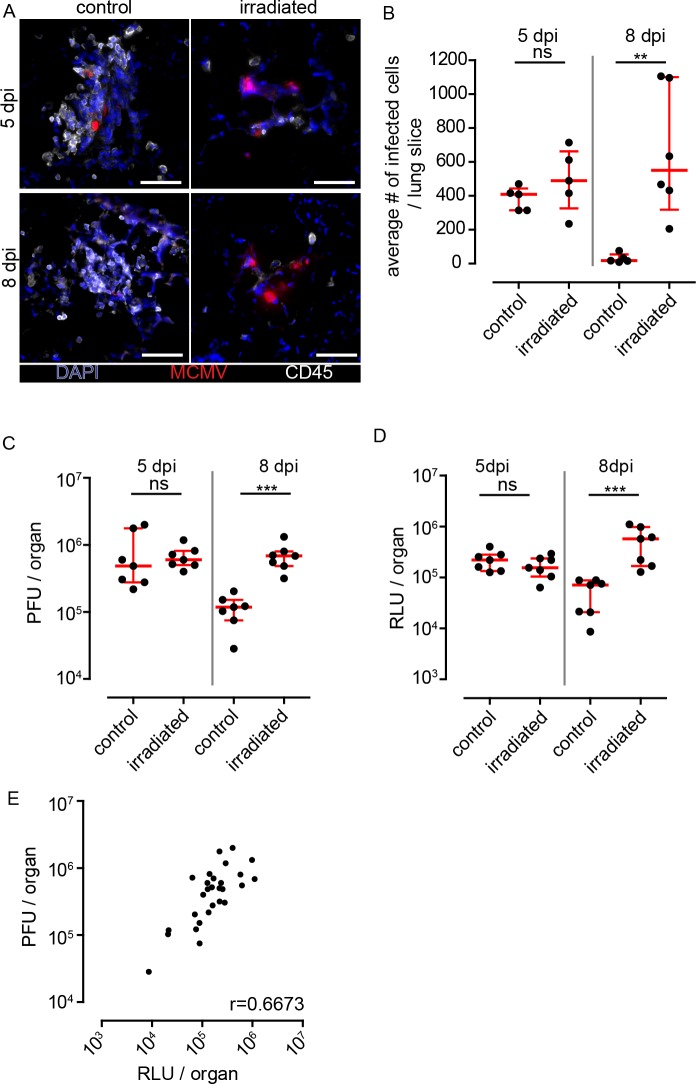
Fig 2. Absence of NIFs and increased infected cell counts in gamma-irradiated mice.
Animals were either irradiated with 6 Gy or not (control) and infected one day post irradiation with 106 PFU MCMV-3D i.n. (A) Immunofluorescence of NIFs or clusters of infected cells in irradiated (right panel) or control mice (left panel) 5 and 8 dpi stained with anti CD45 mAb (white), infected cells expressing mCherry (red) and nuclear staining with DAPI (blue); scale bar 50 μm. (B) Quantitative analysis of infected cells on histological sections of whole lungs, (C) analysis of virus titers in lungs, and (D) luciferase activity in lungs 5 and 8 dpi of irradiated and control mice. (B) Dots represent means of 3–4 lung slices analyzed per animal, (C) dots represent means of triplicates analyzed per organ, (D) dots represent mean of duplicates per organ; (B-D) median + interquartile range (red); data pooled from 2 independent experiments; Mann-Whitney test; (E) Correlation of virus titers and luciferase activity in lungs; pooled data of 5 and 8 dpi. Dots represent means per organ; r: Spearman coefficient. PFU, plaque forming units; RLU, relative light units; data pooled from 2 individual experiments.

