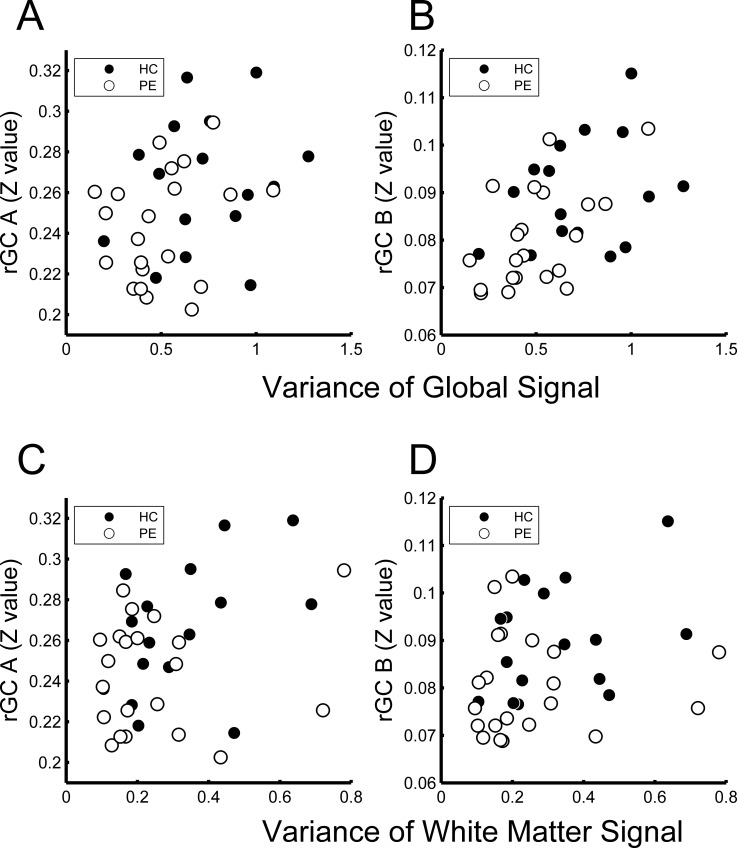
Fig 4. Relationships between variances of global and mean white matter signals and regional global connectivity (rGC) values.
Variance of the global signal was related to the value of rGC at ROI_A (rGC A) (rho = 0.34, p = 0.038, by Spearman’s method) (A) and the value of rGC at ROI_B (rGC B) (rho = 0.51, p = 0.0014) (B). Variance of the mean white matter signal was not related to the value of rGC at ROI_A (rho = 0.29, p = 0.09) (C) or ROI_B (rho = 0.27, p = 0.11) (D).

