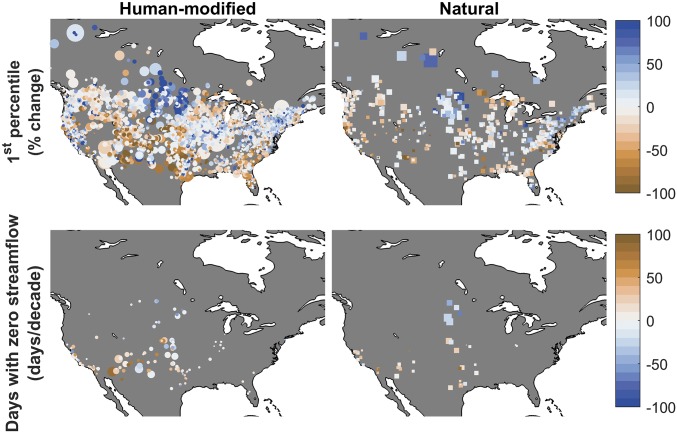
Fig. 3.
Trends in streamflow metrics for the 1981–2015 water years for low streamflow metrics. The sizes of the circles (human modified) and squares (natural) represent the relative area of the upstream drainage area. For the days with zero streamflow days panel, only gauges where trends in zero streamflow days exist are shown. Due to the differences in drainage areas, the sizes of the squares and circles are not directly comparable.

