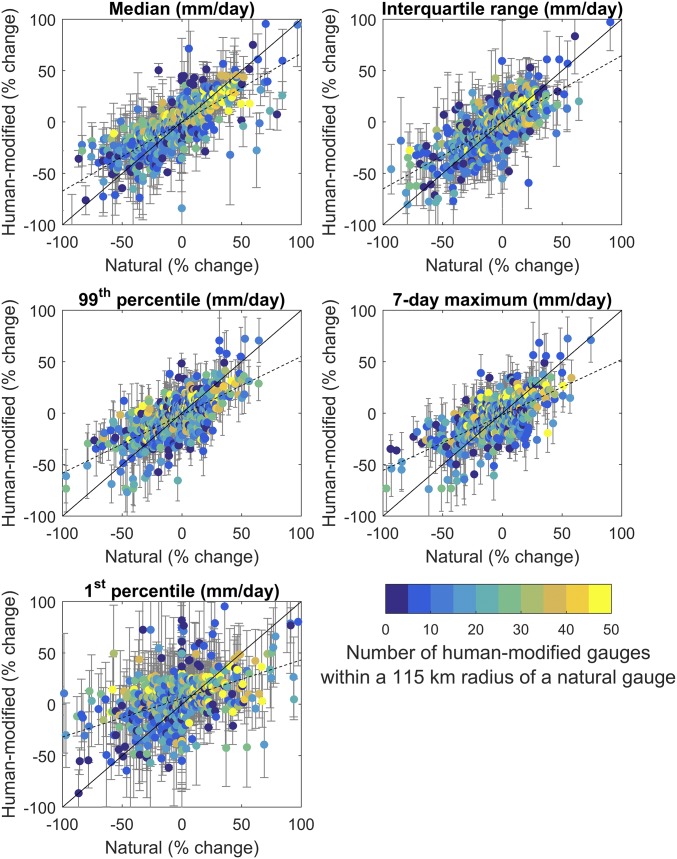
Fig. 4.
Scatterplots of natural versus nearby human-modified streamflow trends (in percent change) for the 1981–2015 water years. The solid black line is the 1:1 line, and the dashed line is the least-squares regression (plotted for reference). The mean of trends from all human-modified gauges within 115 km of a natural gauge was estimated and compared against trends from natural gauges (Materials and Methods). The color bar indicates the number of human-modified streamflow gauges used to estimate the mean, and the uncertainty bar shows the mean absolute deviation of trends between the human-modified streamflow gauges.

