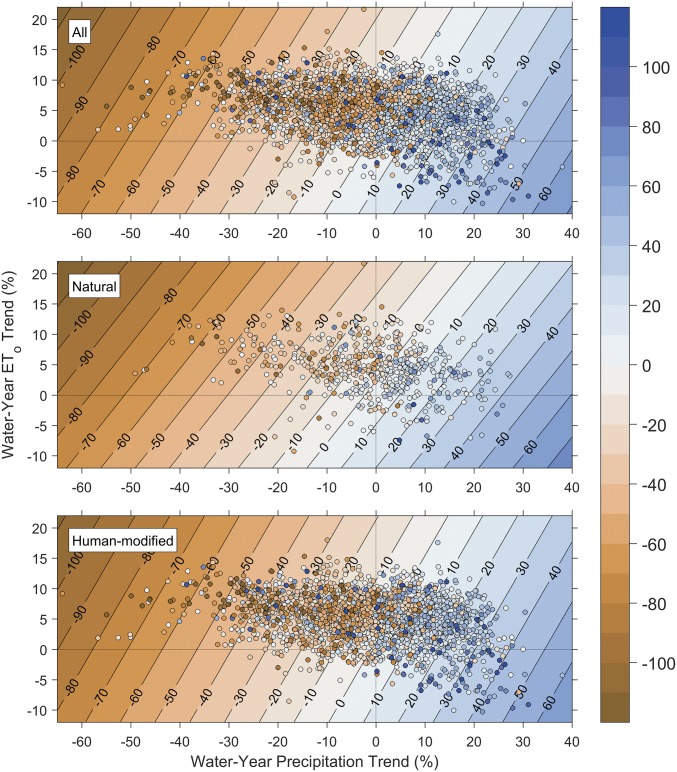
Fig. 5.
Response surfaces for all watersheds (Top), natural watersheds (Middle), and human-modified watersheds (Bottom) of the linear regression of trends in median daily streamflow (percentage change) on trends in total water-year reference evapotranspiration (y axes) and total water-year precipitation (x axes) (both in percent change) for the 1981–2015 water years. Color of filled circles shows the trend in median daily streamflow for each station.

