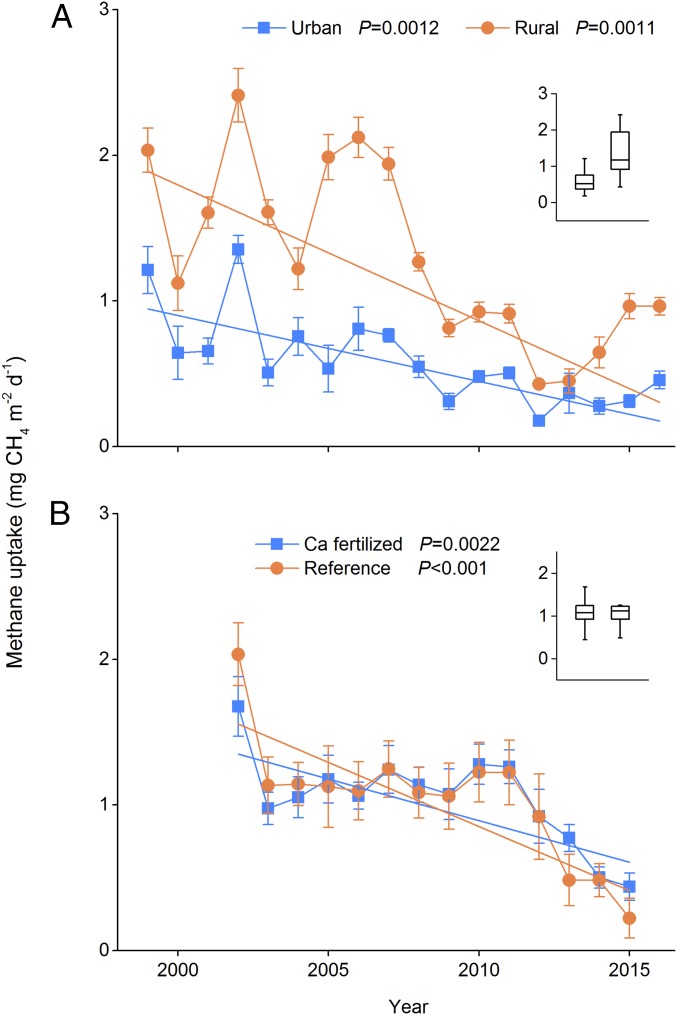
Fig. 1.
Annual CH4 uptake. (A) CH4 uptake (±SE, n = 8–16) in urban and rural forests in Baltimore, Maryland, from 1999 to 2016 (annual means calculated for a “water year” from October to September). (B) CH4 uptake (±SE, n = 12) in calcium (Ca) fertilized and reference forests at Hubbard Brook, New Hampshire, from 2002 to 2015. Differences between forest types are significant in Baltimore (all P < 0.05 except in 2000 and 2013) but not significant (all P > 0.05) at Hubbard Brook for each year. The Insets represent average CH4 uptake during the study period in urban (Left) versus rural (Right, n = 18, P < 0.001) or Ca-fertilized (Left) versus reference (Right, n = 14, P = 0.87) forests. The boxes show median and 5th and 95th percentiles. All trends with time are statistically significant (P < 0.01) (SI Appendix, Table S4).

