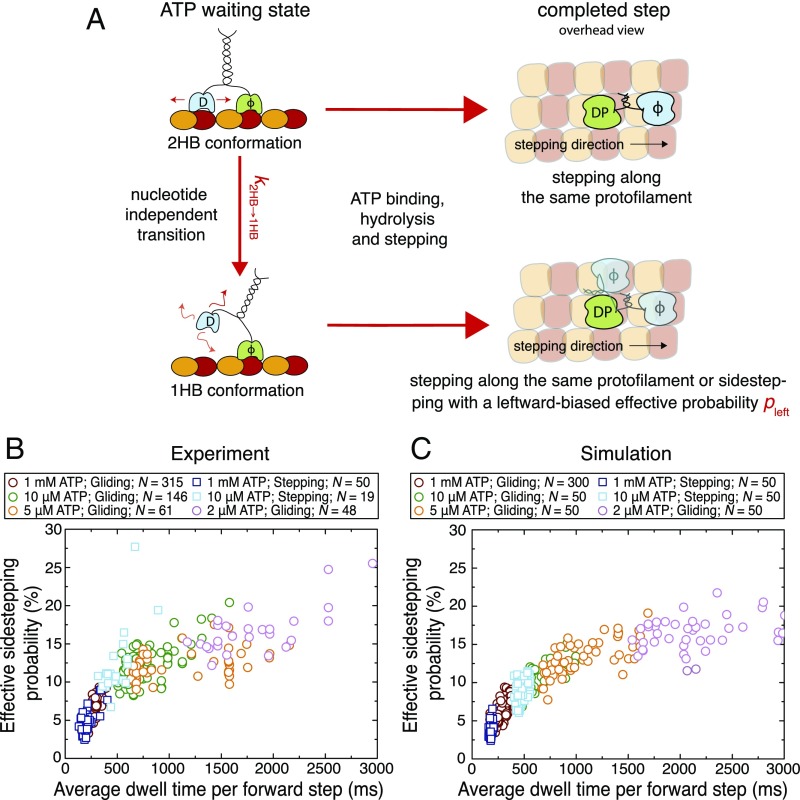
Fig. 3.
Effective sidestepping probability increases with longer average dwell times per forward step. (A) Illustration of the proposed model to explain the increase in the effective sidestepping probability seen in Fig. 2C. We suggest that Kip3 can undergo a nucleotide-independent transition from a 2HB conformation to a 1HB conformation () in the ATP waiting state. Further, sidestepping is strongly enhanced from the 1HB conformation (with an effective sidestepping probability ). Here, T denotes ATP, D denotes ADP, DP denotes ADP plus phosphate, and ϕ denotes no nucleotide. Loose binding and diffusion are represented by small red arrows. (B) The effective sidestepping probability per forward step is shown in dependence of the average dwell time per forward step for Kip3-QD stepping assays (squares) at 1 mM (blue, n = 50) and 10 μM ATP (cyan, n = 19) as well as for microtubule gliding assays (circles) at 1 mM (red, n = 315), 10 μM (green, n = 146), 5 μM (orange, n = 61), and 2 μM ATP (pink, n = 48). (C) The simulated effective sidestepping probability per forward step is shown in dependence of the average dwell time per forward step for stepping assays (50 single-molecule tracks at 1 mM and 10 μM ATP) as well as for gliding assays (300 microtubules at 1 mM and 50 microtubules each at 10 μM, 5 μM, and 2 μM ATP; same markers and colors as in B). Parameters of the numerical simulation are given in SI Appendix, Table S1. In the simulations, the difference between stepping and gliding assays is only the probability of futile steps (ranging between 0% and 50% for gliding events and between 0% and 20% for stepping events) to account for the experimentally observed velocity variations (SI Appendix, Fig. S7 and Materials and Methods).

