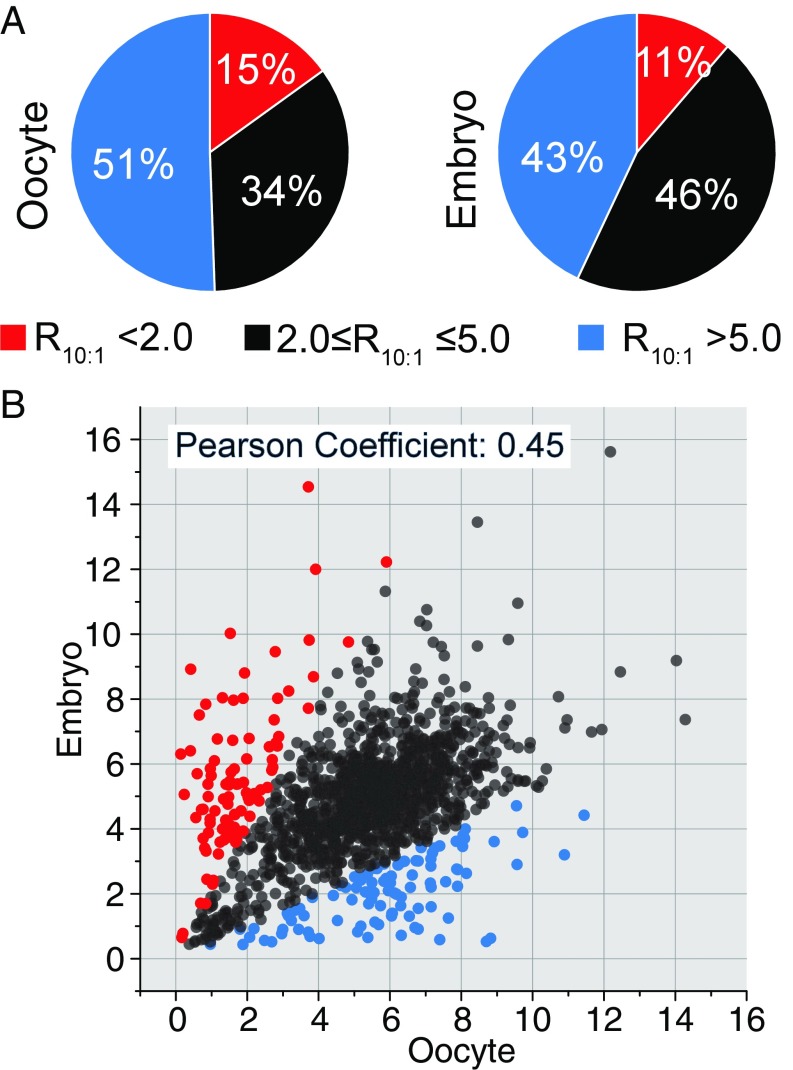
Fig. 2.
Cysteine-reactivity profiling of the oocyte-to-embryo transition. (A) Pie charts showing the distribution of cysteine reactivity of the Drosophila stage-14 enriched ovary and 0- to 1-h embryo proteome. (B) Correlation of proteomic cysteine reactivity quantified in stage-14 enriched ovaries and 0- to 1-h embryos. The determined R10:1 values of the cysteines present in both ovary and embryo samples are plotted against each other for comparison. Cysteines with an Rova10:1/Remb10:1 ratio >2 are in blue; cysteines with an Rova10:1/Remb10:1 ratio <0.5 are in red. Heavy/light (100 μM/10 μM) ratios were calculated from at least three biological replicates, with two technical runs for each.

