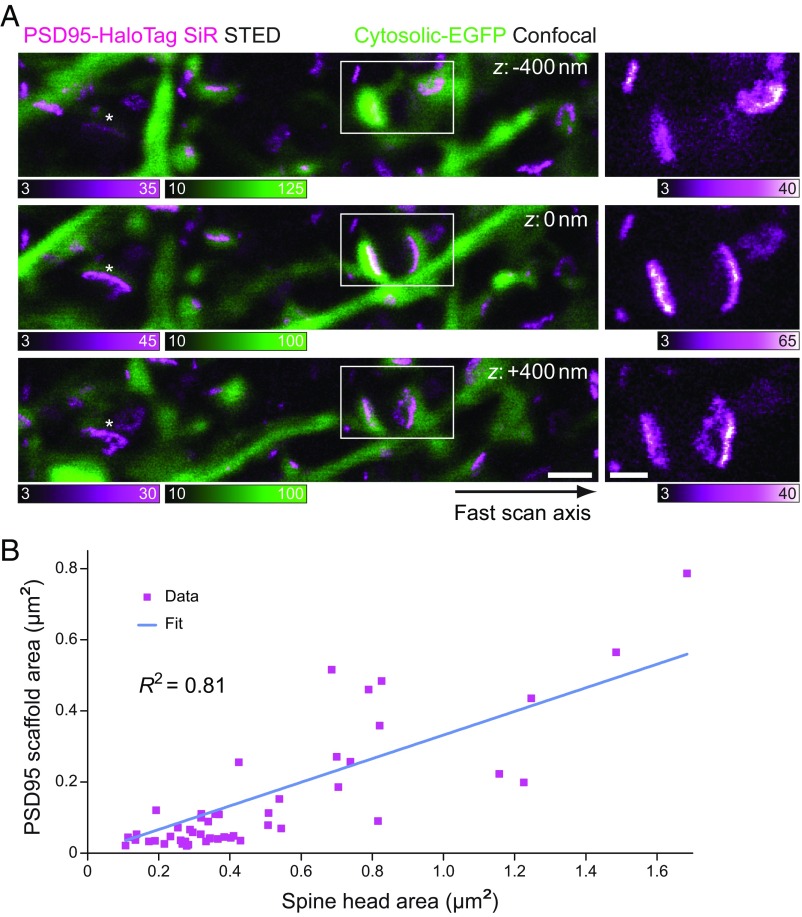
Fig. 5.
PSD95 nanomorphologies related to spine shapes and sizes. (A) The 3D context of in vivo nanoscale PSD95 scaffold morphologies. (Left) Overlays of STED images of PSD95 (magenta) with the corresponding confocal images of cytosolic EGFP (green) from a -stack image series. Individual images were recorded with a 400-nm axial step size (acquisition order: : 0 nm, −400 nm, +400 nm). (Right) Magnified views of marked regions (white boxes) in the corresponding STED images on the left. The apparent morphologies of individual imaged PSD95 scaffolds are dependent on the orientation of the synapse with respect to the focal plane, such that the appearance of a PSD95 scaffold structure can change with the focal plane from a thin elongated appearance to a complex morphology. The asterisks mark an additional scaffold whose appearance changed with the focal plane. The fast scan axis for all images shown is indicated by an arrow. Counts stated are counts per 30 µs. All images were smoothed for display with a one-pixel-wide Gaussian filter. Imaging parameters are listed in SI Appendix, Table S1. [Scale bars: 1 μm (overlay), 500 nm (magnified views).] (B) Correlation of PSD95 scaffold area (imaged in STED mode) and corresponding spine-head area (imaged in confocal mode), both estimated from determinations of the respective short- and long-axis diameters. The blue line represents a linear fit of the data (N = 49 selected spines from a range of sizes; Pearson’s R2 = 0.81). PSD95 scaffolds without a matching Lifeact-EYFP spine head were not included.

