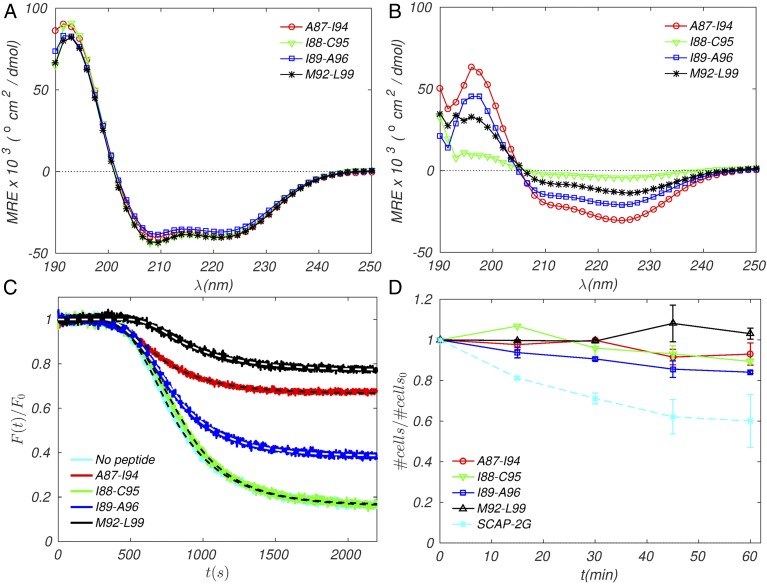
Fig. 7.
Experimental tests of inhibitors. (A and B) CD spectra of hydrocarbon-stapled EmrE TM4 peptides in bacterial membrane mimetics: (A) 20 M peptides in buffer (10 mM Tris HCl, 10 mM NaCl, pH 7.4) and 140 mM SDS; (B) 20 M peptides in 2.5 mM POPC:POPG (3:1 M ratio). Spectra shown represent the average of three independent samples. (C) Inhibition of ethidium efflux by stapled peptides. E. coli cells were grown in minimal media and incubated with the ionophore CCCP, EtBr, and either DMSO or peptide (4 M) in DMSO. Cells were placed in fresh media (lacking CCCP) to observe fluorescence decay of ethidium as it is pumped from the cells. Fluorescence intensity is normalized to the initial value. Spectra shown represent the average of three independent experiments; dashed lines represent computed fits to the exponential decay model with initial plateau (see Materials and Methods). (D) Cell toxicity assay. E. coli cells were grown in minimal media in the presence or absence of peptide (4 ). was measured over 1 h in 15-min intervals. All time points are normalized to the starting time point and cell growth in the absence of peptide. S-CAP-2G is included as a positive control for cell toxicity [sequence: KKKKKK-AGFAAWAAFGA-; hydrocarbon-stapled positions indicated by A; the shorter + 4 hydrocarbon staple was used (41)]. Each curve represents the average of two independent experiments. Error is indicated as SEM.

