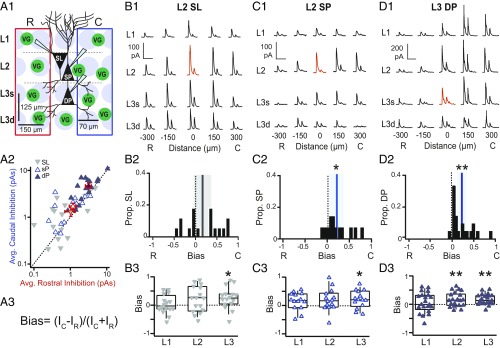
Fig. 1.
Caudally biased, asymmetric inhibition within recurrent circuitry of APC. (A1) Schematic of the grid stimulation paradigm for excitatory neurons: L2: SL cells and superficial PCs (L2 SP); L3: deep PCs (L3 DP). VG indicates interneuron expressing ChR2 under VGAT promoter. Red or blue rectangles encompass sites included in the average of rostral or caudal inhibition, respectively. C, caudal; R, rostral. (A2) Average rostral vs. caudal inhibition (red and blue rectangles, respectively, in A1) for each cell class. Filled blue triangles, L3 PC; inverted gray triangles, SL; open blue triangles, L2 PC. (A3) Equation for Bias metric. I is the average inhibition across caudal (IC) or rostral (IR) sites. Bias is calculated either over all layers as in shown A1 or by layer as in B3, C3, and D3. In L3, superficial (L3s) and deep layers (L3d) are combined as a single layer. Bias is bounded between −1 and 1. Negative values correspond to greater average inhibition from rostral sites, while positive values correspond to greater inhibition from caudal sites. (B1) IPSCs recorded during focal light stimulation at each grid location in a representative SL cell. Red trace indicates the location of the recorded cell. (Scale bars: vertical, 100 pA; horizontal, 200 ms.) (B2) SL bias values of inhibition averaged across all layers (A1). The black line indicates mean bias, and gray shading indicates 95% confidence intervals. SL population bias was not asymmetric and did not significantly differ from zero. (B3) SL bias values calculated for each layer (box, bottom 25%, middle 50%, and top 75%; whiskers, bottom 10% and top 90%). SL cells receive significant caudally biased inhibition only from L3. *P < 0.05 (one-sample t test). (C1–C3 and D1–D3) Descriptions are the same as in B1–B3. (C1) IPSCs recorded from a representative L2 PC. (Scale bars: vertical, 100 pA; horizontal, 200 ms.) (C2) Bias values for inhibition averaged across all layers (A1). The blue line indicates mean bias, and blue shading indicates 95% confidence intervals. L2 PCs receive stronger inhibition from caudal vs. rostral sites. *P < 0.05 (n = 14, one-sample t test). (C3) L2 PC bias values calculated for each layer. L2 PCs receive significant caudally biased inhibition from L3. *P < 0.05 (one-sample t test). (D1) IPSCs recorded from a representative L3 PC. (Scale bars: vertical, 200 pA; horizontal, 200 ms.) (D2) L3 PC bias values for inhibition averaged across all layers (A1). L3 PCs receive stronger inhibition from caudal vs. rostral sites. **P < 0.01 (n = 21, one-sample t test). (D3) L3 PC bias values calculated for each layer. L3 PCs receive significant caudally biased inhibition from interneurons in L2 and L3. C, caudal; R, rostral. **P < 0.01 (one-sample t test).

