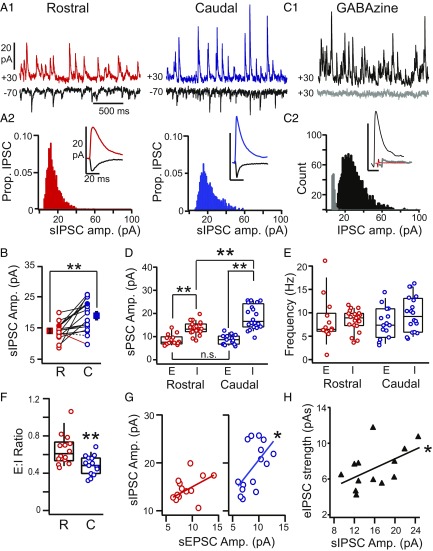
Fig. 3.
Comparison of sIPSCs in rostral vs. caudal PCs. (A1) Representative smoothed traces (details are in SI Appendix, SI Methods and Fig. S4) showing sEPSCs (black) and sIPSCs in rostral (red; Left) and caudal (blue; Right) PCs recorded in the same slice. (A2) The amplitude distributions of sIPSCs recorded in the neurons shown in A1. (Insets) Average sEPSCs (black) and sIPSCs recorded in the rostral (red) and caudal (blue) PCs shown in A1. (B) Average sIPSC amplitudes for all RC cell pairs. In the majority of pairs, sIPSCs were stronger in the caudal (C) PC (solid black lines; P < 0.05, unpaired t test). In one pair, the rostral (R) PC had stronger IPSCs (red line; P < 0.05). One pair did not significantly differ (dashed black line). The average sIPSC amplitude across all caudal PCs was significantly greater than rostral PCs. **P < 0.01 (paired t test). (C1) Traces showing representative sIPSCs (black) blocked by GZ (5 µM; gray). (C2) sIPSC amplitude distributions before (black) and after (gray) GZ. (Inset) Average sIPSC before (black) and after (gray) GZ; the red line is the average nonevent that corresponds to baseline noise. Traces are offset for visibility. (D) sEPSC (E) and sIPSC (I) amplitude in rostral (red) and caudal (blue) PCs. **P < 0.01 (ANOVA). (E) sEPSC (E) and sIPSC (I) frequency in rostral (red) and caudal (blue) PCs. (F) Ratio of sEPSC to sIPSC amplitude (E:I ratio) in rostral vs. caudal PCs. **P < 0.01 (t test). (G) sIPSC amplitude vs. sEPSC amplitude in rostral (Left; red) and caudal cells (Right; blue). *P < 0.05. (H) Evoked IPSC amplitude vs. sIPSC amplitude is positively correlated in PCs. *P < 0.05.

