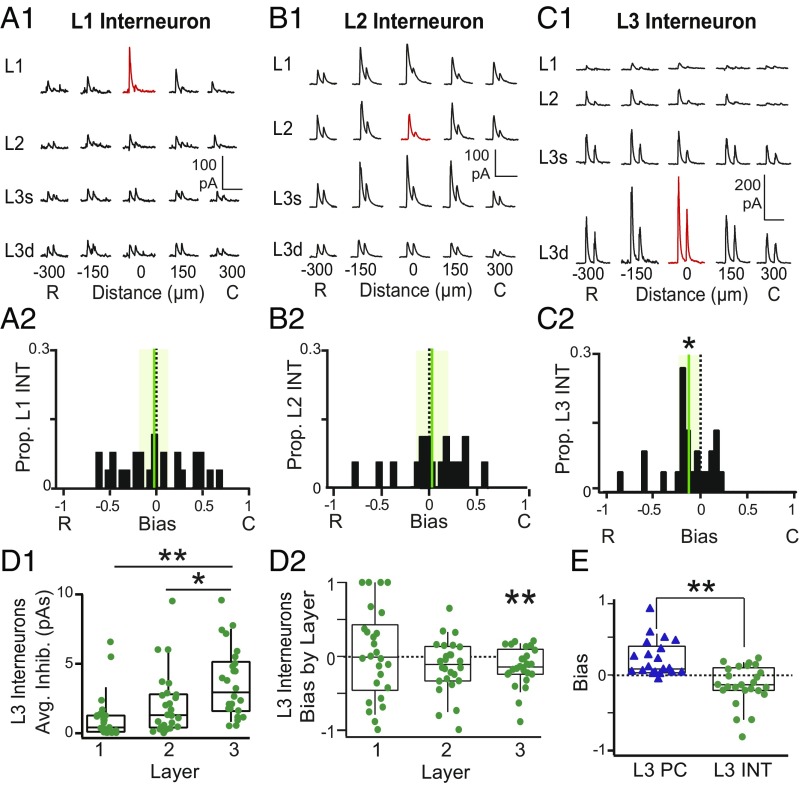
Fig. 4.
Rostrally biased, asymmetric inhibition of L3 interneurons. (A1) IPSCs recorded during focal light stimulation at each grid location in a representative L1 interneuron (INT). Red traces indicate location of recorded cell. (A2) The distribution inhibitory bias values for the L1 INTs. The mean (green vertical line) does not differ from zero; the shaded green bar corresponds to the 95% confidence interval around the mean. (B1) IPSCs recorded during focal light stimulation at each grid location in a representative L2 INT. (B2) The distribution inhibitory bias values for the L2 INTs. The mean bias does not differ from zero. (C1) IPSCs recorded from a representative L3 INT. (Note the change in the vertical scale bar to 200 pA. Horizontal scale bars: A1–C1, 200 ms.) (C2) Asymmetric distribution of negative bias values in L3 INT indicates stronger inhibition from rostral vs. caudal sites. *P < 0.05 (n = 25, one-sample t test). (D1) L3 interneurons receive significantly stronger inhibition from stimulation sites in L3 than L1 or L2. *P < 0.05 (ANOVA); **P < 0.01 (ANOVA). (D2) Bias values calculated for each layer for L3 interneurons. L3 interneurons receive significant rostrally biased inhibition from other L3 interneurons. **P < 0.01 (one-sample t test). (E) The bias values of L3 PCs (blue triangles) significantly differed from L3 INTs (green circles). C, caudal; R, rostral. **P < 0.01 (unpaired t test).

