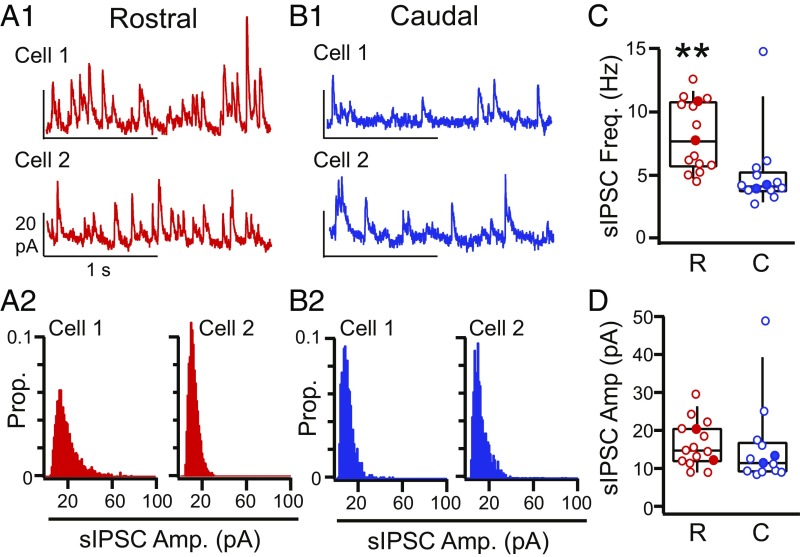
Fig. 5.
Comparison of sIPSCs in rostral vs. caudal L3 interneurons. (A1) Representative traces and (A2) sIPSC amplitude histograms from two different rostral L3 interneurons (red). (B1) Representative traces and (B2) sIPSC amplitude histograms from two different caudal L3 interneurons (blue). (C) sIPSC frequency significantly differed in rostral (R; red) vs. caudal (C; blue) interneurons (box: bottom 25%, middle 50%, and top 75%; whiskers: bottom 10% and top 90%). Filled circles indicate data from neurons shown in A and B. **P < 0.01 (Welch’s t test). (D) sIPSC amplitude in rostral (R; red) vs. caudal (C; blue) interneurons (box: bottom 25%, middle 50%, and top 75%; whiskers: bottom 10% and top 90%). Filled circles indicate data from neurons in A1, A2, B1, and B2.

