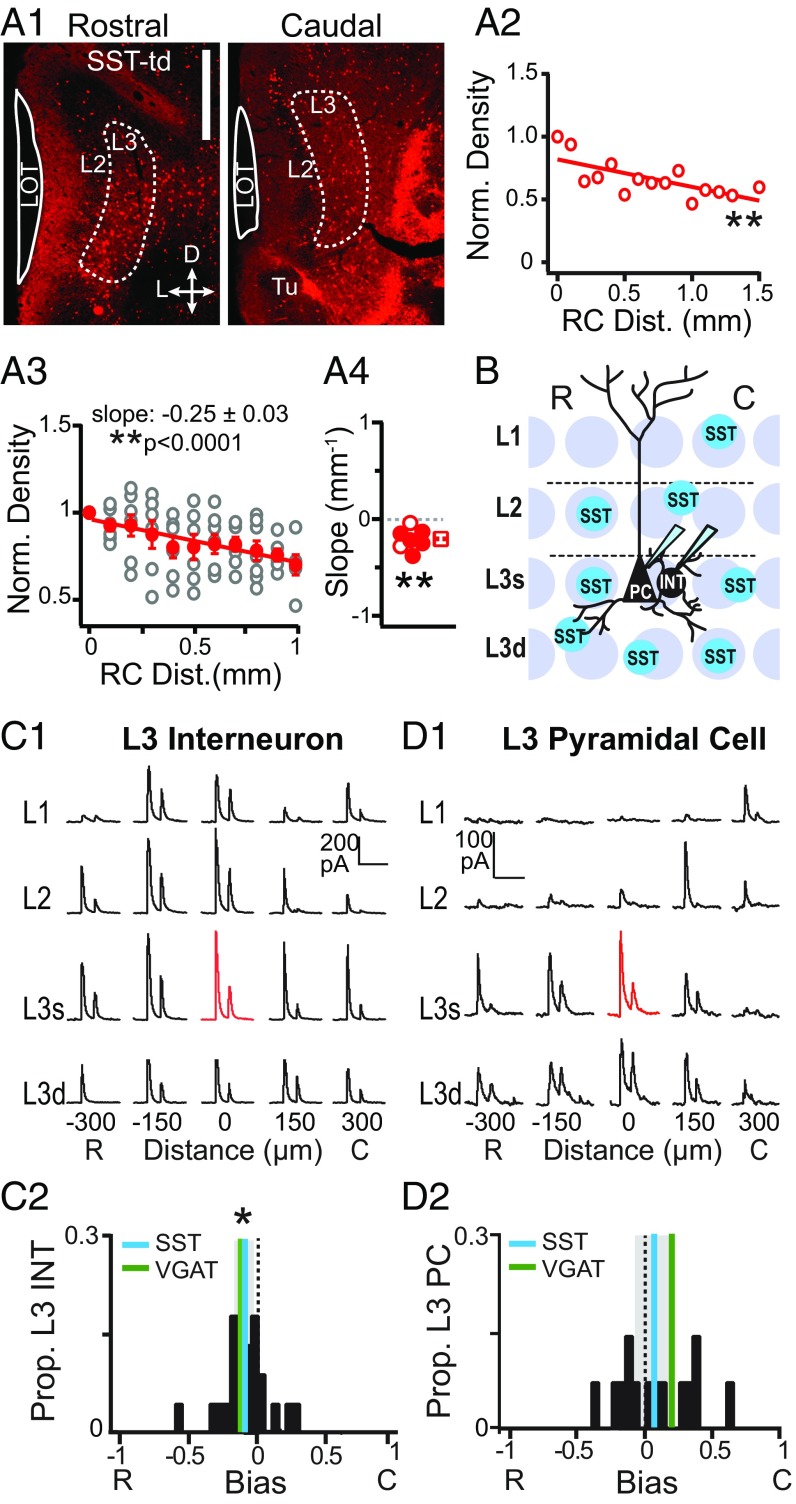
Fig. 6.
Spatial profiles of SST cell-mediated inhibition. (A1) Representative coronal sections from rostral (0–200 µm; Left) and caudal (within last 300 µm; Right) APC showing SST-tdTom(+) cells in an L3 region of interest (dashed line). (Scale bar: 500 µm.) (A2) Normalized density vs. RC distance for the mouse shown in A1. **P < 0.01. (A3) Normalized density of SST cells vs. distance for all mice (open circles). The average (±SE; n = 7) normalized density of SST cells across mice significantly decreased with RC distance (red circles). **P < 0.01. (A4) Distribution of slopes from linear fits to data from individual mice. Solid circles indicate significantly negative slopes (P < 0.05). The distribution of slope values was significantly nonzero. **P = 0.002 (MWU). (B) Schematic of the grid stimulation paradigm for L3 PCs and L3 interneurons (INTs) in sagittal sections from SST-ChR2 mice. (C1) IPSCs recorded during focal light stimulation at each grid location in a representative L3 INT. The red trace indicates the location of the recorded cell. (Scale bars: vertical, 200 pA; horizontal, 200 ms.) (C2) The distribution of bias values for L3 INTs is significantly rostrally biased (cyan line; the shaded region is the 95% confidence interval) and does not differ from VGAT-ChR2 mice (green line, P = 0.84, unpaired t test). *P < 0.05 (one-sample t test). (D1) IPSCs recorded from a representative L3 PC. (Scale bars: vertical, 100 pA; horizontal, 200 ms.) (D2) The distribution of bias values in PCs is not asymmetric, and the mean does not differ from zero (P = 0.38; cyan line) compared with the positive, caudally biased mean in VGAT-ChR2 mice (green line). C, caudal; R, rostral.

