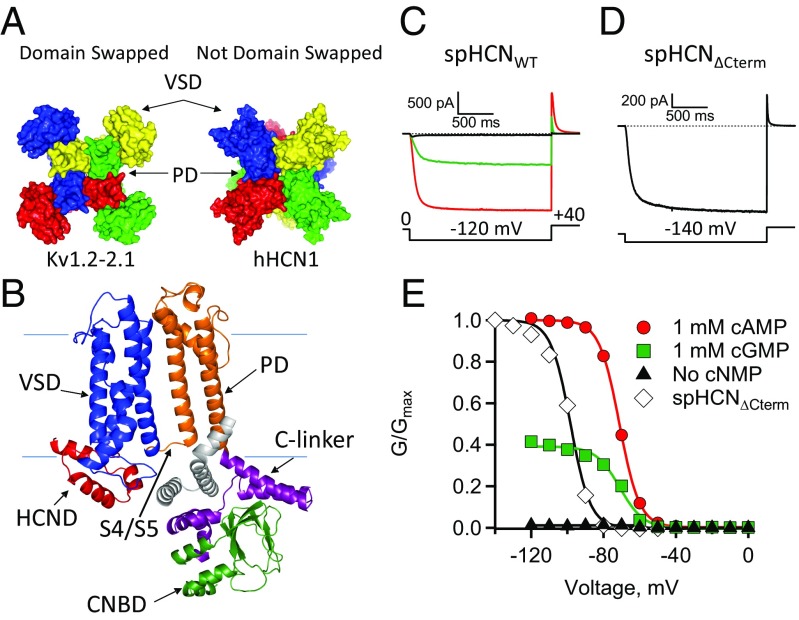
Fig. 1.
HCN channels: structure and function. (A) Top view of Kv1.2-2.1 (PDB ID code 2R9R) and hHCN1 (PDB ID code 5U6O) with subunits in different colors. (B) A subunit of spHCN homology model labeled with VSD (blue), PD (orange), C-linker (purple), CNBD (green), and HCND (red). Also shown is part of the neighboring subunit (gray). (C and D) ZD7288-subtracted currents measured in the absence of ligand (black, triangles), 1 mM cGMP (green, squares), or 1 mM cAMP (red, circles) (Materials and Methods). (C) SpHCNWT currents (D) SpHCN∆Cterm currents (diamonds). (E) GV curves with smooth lines that represent Boltzmann fits (SI Appendix, Table S1).

