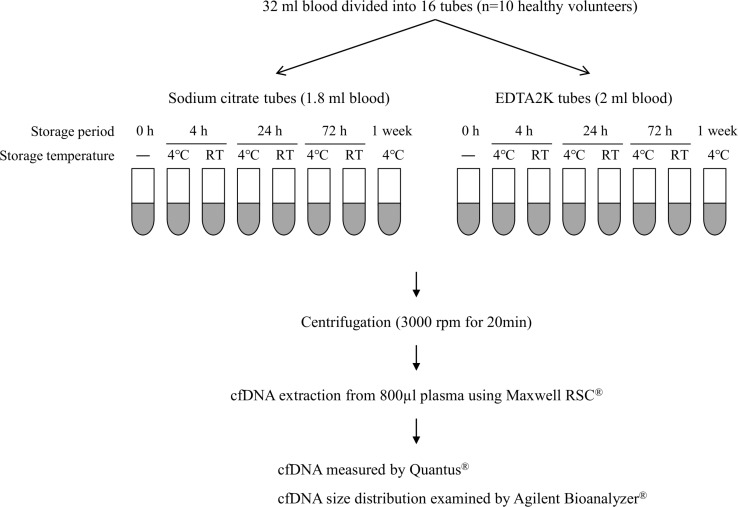
Figure 1. Schema for examining effects of anticoagulant and storage condition on quality of cfDNA.
A total of 32 ml blood was collected from each of ten healthy volunteers and divided into eight sodium citrate tubes and eight EDTA 2K tubes. Blood in each collection tube was stored at 4° C or RT for the indicated period. Plasma separation and cfDNA extraction were performed as shown in this figure. cfDNA quality was evaluated by measuring cfDNA concentration with Quantus® and by analyzing cfDNA size distribution with Agilent Bioanalyzer®.

