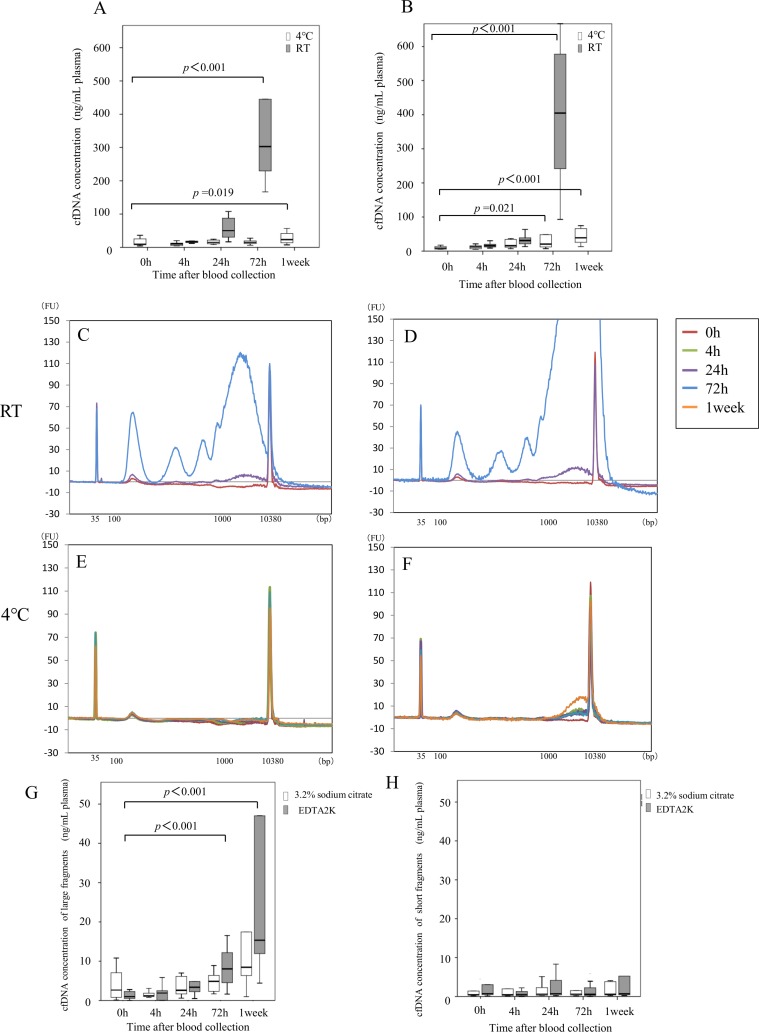
Figure 2. Influence of anticoagulant and blood preservation conditions on quality of cfDNA from healthy volunteers.
cfDNA concentrations were examined at the indicated time after blood collection using sodium citrate tubes (A) or EDTA 2K tubes (B) from ten healthy volunteers. Blood storage temperature until plasma separation was 4° C (white box) or room temperature (gray box). Size distribution of plasma DNA was analyzed with an Agilent bioanalyzer®; representative examples are shown in panels C-F. Sodium citrate tubes (C, E) or EDTA 2K tubes (D, F) were used for blood collection, and blood storage until plasma separation was at RT (C, D) or 4° C (E, F). DNA concentration of 1000 bp to 9000 bp fragments (G) and of 100 bp to 250 bp fragments (H) in all samples stored at 4° C was measured with an Agilent bioanalyzer® as described in “Materials and methods”. Blood was collected into sodium citrate tubes (white box) or EDTA 2K tubes (gray box). Statistical analyses were performed with Friedman’s rank test.

