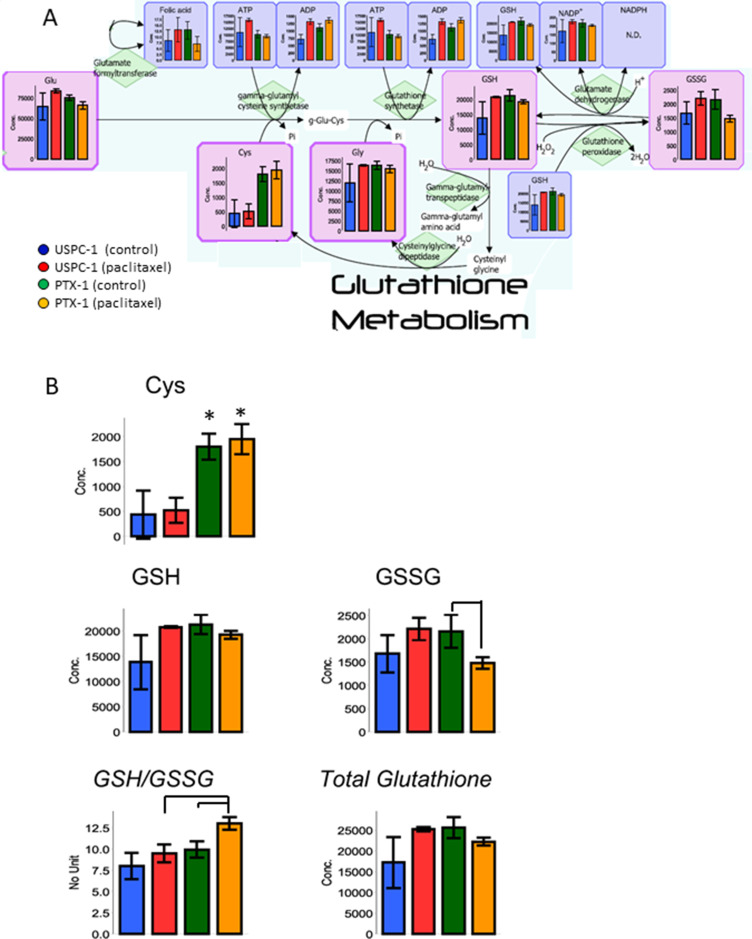
Figure 5. Glutathione (GSH) metabolism analysis after treatment with paclitaxel in uterine serous carcinoma cells.
(A) Each cell line was treated with 15 nM paclitaxel or control vehicle for 24 h. Blue bars represent USPC-1 cells (control), red bars represent USPC-1 cells treated with paclitaxel, green bars represent PTX-1 cells (control) and yellow bars represent PTX-1 cells treated with paclitaxel. Values in the graphs represent the means ± SD of three independent experiments. (B) Concentrations of cysteine, GSH, GSSG and total glutathione in USC cells after treatment with paclitaxel. GSH/GSSG (glutathione redox ratio) = [GSH]/[GSSG]. Total glutathione = [GSH] + 2 × [GSSG], *P < 0.05. N.D.: not detected.

