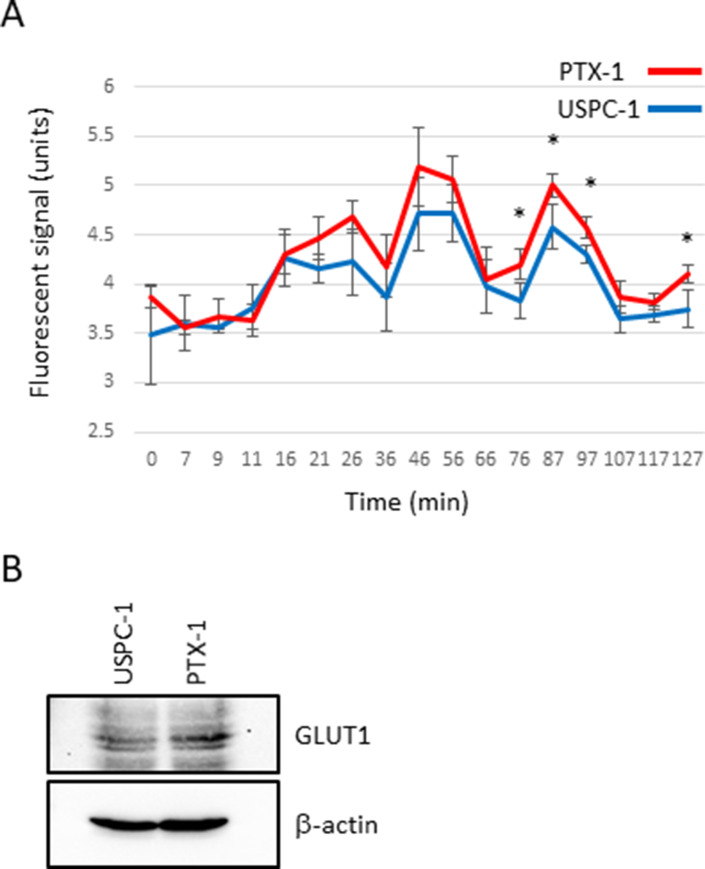
Figure 9. Glucose consumption and glucose transporter expression in uterine serous carcinoma cells.
(A) Oxygen consumption assay. USPC-1 and PTX-1 cells were seeded in a 96-well plate at density of 8.0 × 10⁴ cells. The plate was read using a fluorescence plate reader. The excitation and emission spectra were 380 nm and 650 nm, respectively. The values in the graphs represent means ± SD of three independent experiments. *P < 0.05. (B) USPC-1 and PTX-1 cells were subjected to immunoblot analysis of GLUT1 and β-actin.

