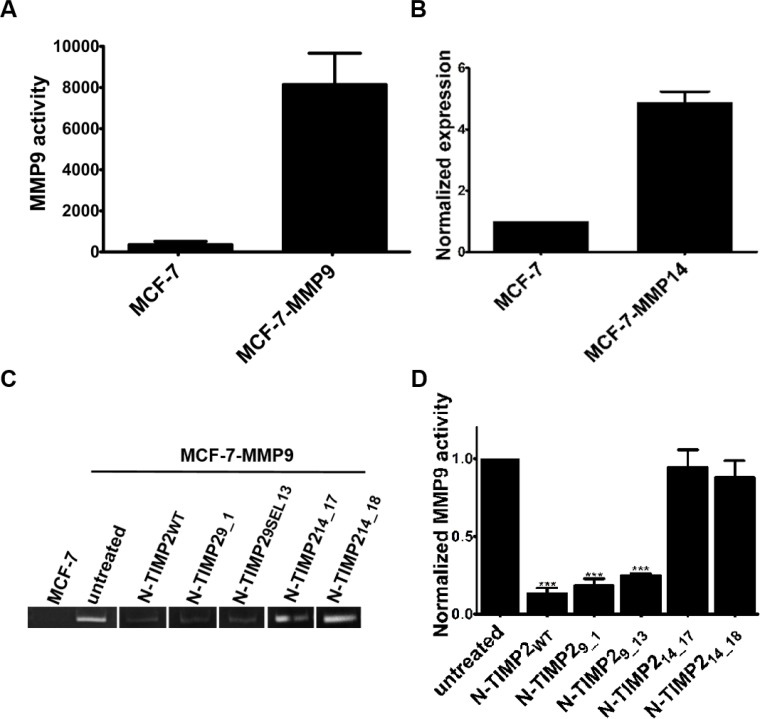
Figure 5. Gelatin degradation by MMP9 produced in MCF-7-MMP9 cells.
(A) Band intensity quantification of gelatin zymography analysis of media collected from MCF-7 and MCF-7-MMP9 cells. Band intensities were quantified by ImageJ software. (B) Normalized expression of MMP14 in MCF-7 and MCF-7-MMP14 cells was confirmed by flow cytometry using rabbit anti-MMP14 antibodies and secondary goat anti-rabbit PE antibodies. (C) Representative results of gelatin zymography analysis of media collected from untransfected MCF-7-WT cells and MCF-7-MMP9 cells stably expressing MMP9 resolved in SDS-PAGE and treated with 100 nM of the inhibitors. (D) Quantification of band intensity normalized to the intensity obtained with control (untreated) cells. All the the experiments were performed in triplicate; means and standard error are shown. In D, ***P < 0.001, as determined in a t test comparing activity in the presence of the various inhibitors versus the untreated control.

