Figure 6.
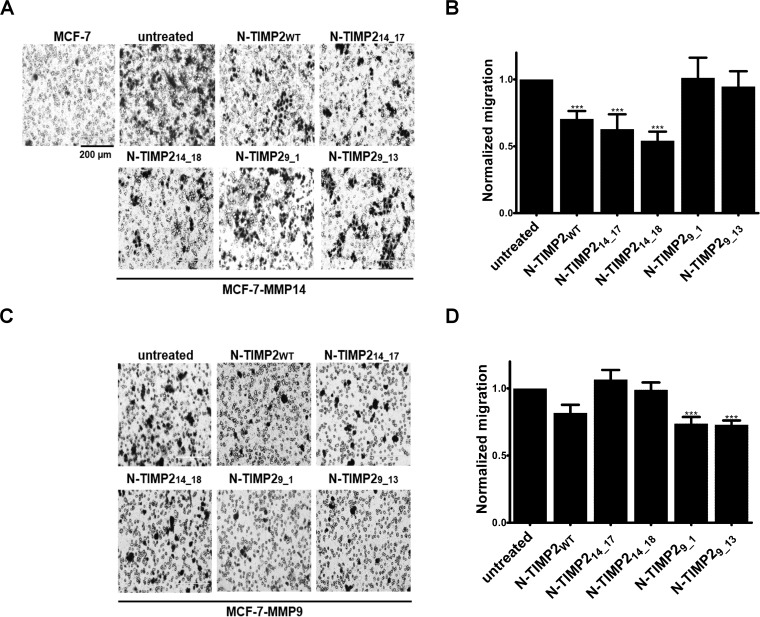
Selective inhibition of MMP14- and MMP9-induced migration (A) Representative micrographs of migrating MCF-7 and MCF-7-MMP14 cells in the presence or absence of 100 nM of the N-TIMP2 inhibitors. The cells were stained with Dipp Kwik Differential Stain and visualized by light microscopy using a ×20 magnification lens. (B) Calculated fold of migration of MCF-7-MMP14 cells. The cells were counted using ImageJ software and normalized to counts of untreated cells. (C) Representative micrographs of migrating MCF-7-MMP9 cells in the presence or absence of 100 nM of the N-TIMP2 inhibitors. The cells were visualized as in A. (D) Calculated fold of migration of MCF-7-MMP9 cells. The cells were counted as in B. The experiment was repeated three times; means and standard error are shown. ***P < 0.001, as determined by a t test comparing inhibition in the presence of the various inhibitors versus the untreated control.

