
Fig. 4.
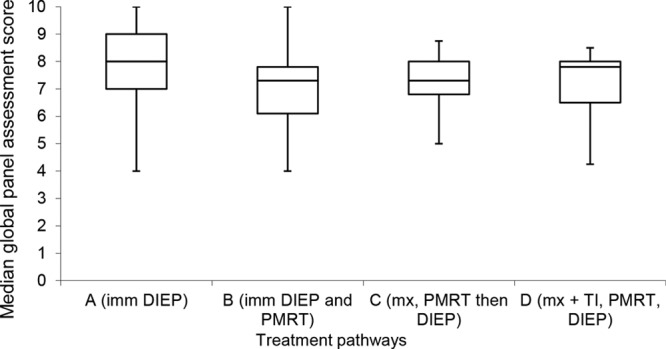
Box-and-whisker plot demonstrating global panel assessment scores according to different treatment pathways. The horizontal line through the center of each box represents the median score, outer horizontal lines of each box represents upper and lower quartiles, and the ends of the vertical lines represent minimum and maximum scores. There was a significant difference between A and B. imm, immediate; PMRT, postmastectomy radiotherapy; mx, mastectomy; TI, temporizing implant.