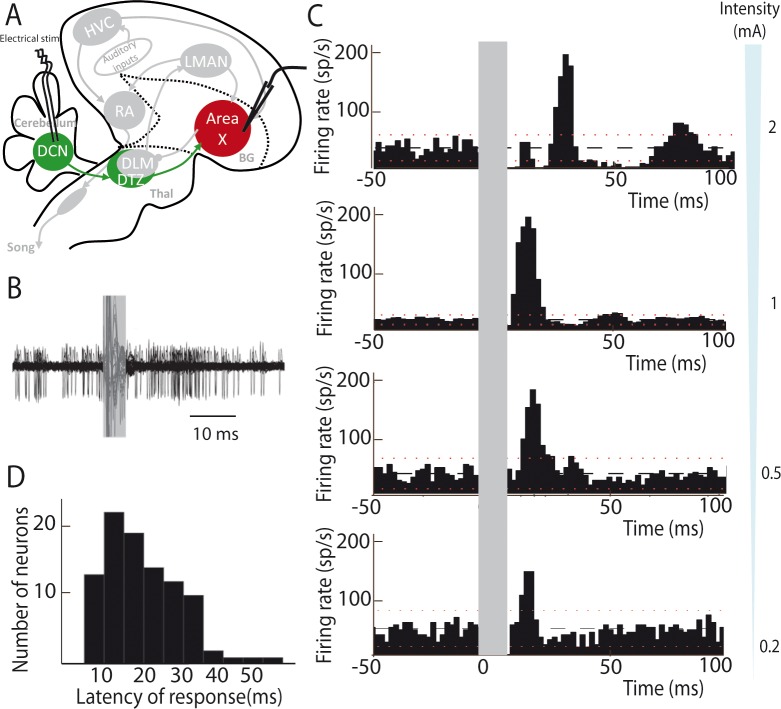
Figure 2. Deep cerebellar stimulation elicits strong excitation in pallidal cells of Area X.
(A) Diagram of the song system in songbirds. In all song system diagrams in Figures 2–6, we highlight nuclei involved in the experiment reported on a given figure in color, while other song system nuclei are in grey shades. The colors used are different for each pathway: red for the song-related basal ganglia-thalamo-cortical circuit composed of the basal ganglia nucleus Area X, the thalamic nucleus DLM, and the cortical nucleus LMAN, green for the cerebello-thalamo-basal ganglia circuit through the DCN and DTZ, and black for the motor pathway composed of HVC and RA. Here, stimulations were performed in the DCN during the recording of pallidal neurons in Area X. HVC: used as a proper name, RA: robust nucleus of the archopallium, LMAN: lateral magnocellular nucleus of the anterior nidopallium, DLM: medial portion of the dorsolateral nucleus of the anterior thalamus, DTZ: dorsal thalamic zone, DCN: deep cerebellar nuclei. (B) Twenty superimposed extracellular recording traces around DCN stimulation show the increase in the number of spikes produced by a representative pallidal neuron following DCN stimulation (grey rectangle) compared to baseline firing. (C) Peri-stimulus-time-histograms (PSTHs) representing the firing rate of 4 different pallidal neurons around DCN stimulation (time bin: 2 ms). The black horizontal dashed line depicts the mean baseline firing rate and red dotted lines indicate confidence intervals (2.5 SD away from the mean baseline firing rate). Different response profiles are shown: excitation only (the two in the bottom, stimulation at 0.2 and 0.5 mA), biphasic response (second PSTH from top, stimulation at 1 mA), or inhibition and biphasic response (top, stimulation at 2 mA). (D) Distribution of response latencies between DCN stimulation and the beginning of the excitatory response (20.80 ± 4.56 ms, median: 21 ms).

