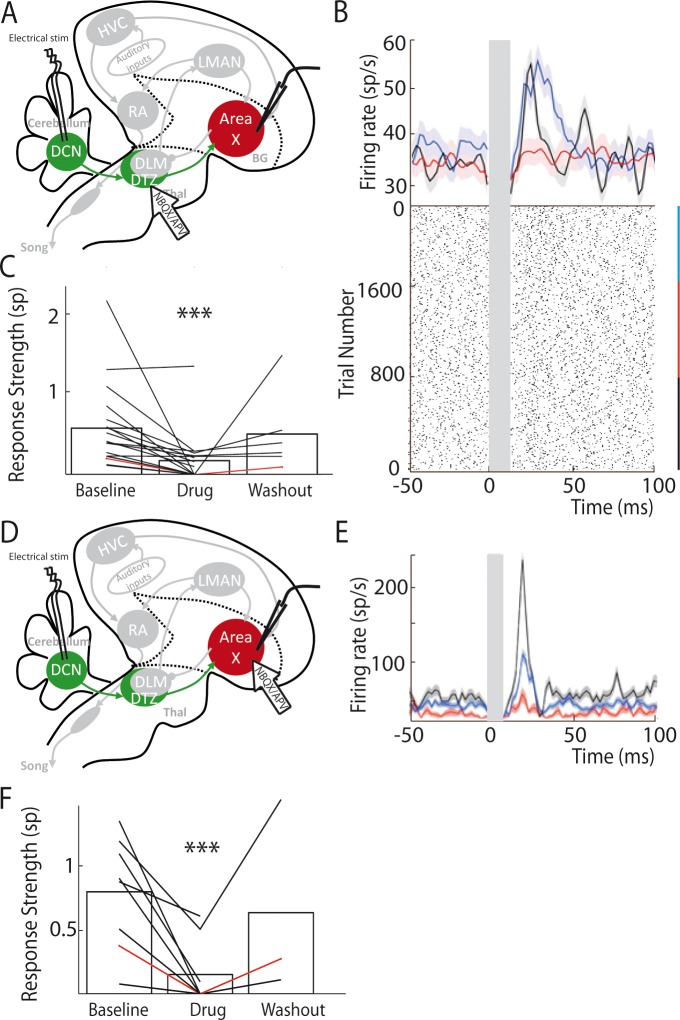
Figure 4. Area X pallidal responses to DCN stimulation are transmitted through excitatory synapses in DTZ and Area X.
(A) Diagram of the song system in songbirds, as in Figure 2A. Recordings were performed in Area X, NBQX/APV were applied in DTZ. (B) PSTH (top part) of a typical pallidal neuron before (black), during (red) and after (blue, washout) drug application in DTZ, and their corresponding raster plots (bottom part). (C) Population data showing the response strength of pallidal neurons in the three conditions (baseline, drug and washout, n = 16 pallidal neurons in 8 birds, paired Wilcoxon test, p value<0.001). The red line represents the example shown in B. (D) Diagram of the song system, as in Figure 2A. Recordings were performed in Area X, NBQX/APV were applied in Area X in proximity to the recorded neuron. (E) PSTH representing the firing rate of one pallidal neuron, before (black), during (red) and after (blue, washout) drug application in Area X. Baseline activity after drug application (red) sometimes slightly decreases in Area X neurons compared to before drug application (black), but no significant change was observed over all neurons recorded in this condition (see Results). (F) Population data showing the evolution of response strength before, during and after drug application (n = 8 pallidal neurons in 7 birds, paired Wilcoxon test, p value<0.001). The red curve represents the example shown in E. In this figure and the following ones, stars indicate significance level (*p<0.05; **p<0.01; ***p<0.001).

