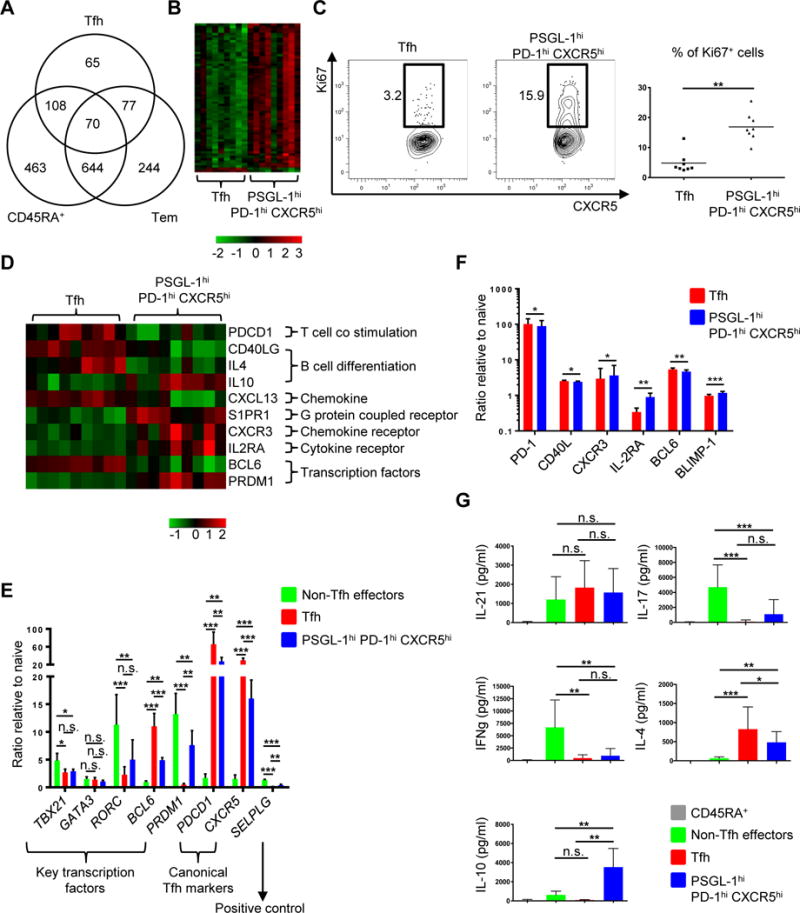
Fig. 3. PSGL-1hi PD-1hi CXCR5hi T cells exhibit unique patterns of gene expression and cytokine profiles in comparison to Tfh cells.

(A) Differentially expressed genes (FDR P < 0.05, log2 fold change > 0.5) between the 4 cell populations were identified in a series of pair wise analyses. The numbers of differentially expressed genes between the indicated cell population and PSGL-1hi PD-1hi CXCR5hi T cells and patterns of overlap are shown in Venn diagram format. Tfh: follicular helper T, Tem: effector memory cells. (B) Heat map of cell cycle genes (gene ontology (GO): 0022403). Columns represent 9 replicates of Tfh and PSGL-1hi PD-1hi CXCR5hi T cells. (C) Ki67 intracellular staining of Tfh and PSGL-1hi PD-1hi CXCR5hi T cells. Representative plots from eight independent experiments (left panel) and percentage of Ki67+ cells in Tfh and PSGL-1hi PD-1hi CXCR5hi T cell populations (right panel) are shown. Bars indicate the mean. n=8, paired t test, **P < 0.01. (D) Heat map of relevant genes differentially expressed between Tfh and PSGL-1hi PD-1hi CXCR5hi T cells (FDR P < 0.05, log2 fold change > 0.5). Columns represent 9 replicates of either Tfh or PSGL-1hi PD-1hi CXCR5hi T cells. (E) Quantitative PCR analysis of key transcription factors and canonical Tfh cell markers. Adjusted by expression of housekeeping gene (ACTIN). N = 4 or 5, One-way ANOVA test. *P < 0.05, **P < 0.01, ***P < 0.001. Bars indicate the mean and the SD. (F) Expression of PD-1, CD40L, CXCR3, IL-2RA, BCL6, and BLIMP-1 on Tfh and PSGL-1hi PD-1hi CXCR5hi T cells. The Y-axis represents the ratio of mean fluorescence intensities (MFI) to those of naïve CD45RA+ T cells. N = 5 or 6, paired t-test. *P < 0.05, **P < 0.01, ***P < 0.001. Bars indicate the mean and the SD. (G) Cytokine profile of CD4+ T cell subsets. Cytokines were measured after 6 hour-stimulation with PMA and ionomycin. N = 6 or more, One-way ANOVA test. *P < 0.05, **P < 0.01, ***P < 0.001. Bars indicate the mean and the SD. Tfh: follicular helper T cells.
