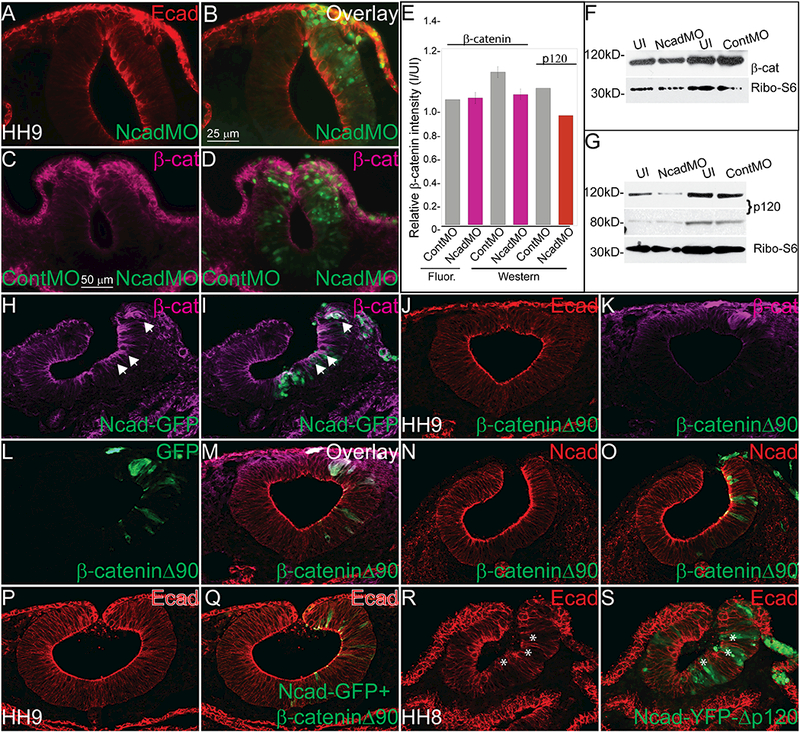
Figure 4. Changes in Ncad and Ecad in response to perturbations are due to competition for β- catenin.

IHC in an HH10 embryo for (A, B) Ecad (N= 21/24) and (C, D) β-catenin (N= 15/20) after injection with NcadMO unilaterally (A-D) or NcadMO on the right side and ContMO on the left (C, D). (E) Relative fluorescence or band intensity of (C, D) β-catenin and (G) p120 catenin in ContMO and NcadMO-injected embryos compared to uninjected calculated using NIH ImageJ64. One-way ANOVA with Tukey’s test was performed to determine significance. Error bars are standard error. There were no statistically significant differences between the treatments. Western blot showing (F) β-catenin (G) p120 levels after NcadMO-injection. IHC for (H, I) β-catenin after injection with Ncad-GFP (N= 11/13). IHC for (J) Ecad (N= 7/9), (K) β-catenin, (L) GFP, and M (overlay) or (N) Ncad (N= 14/14) and (O) overlay after overexpression of dominant active β-catenin (β-cateninΔ90). IHC for (P, Q) Ecad in embryo injected with Ncad-GFP+ β-cateninΔ90 (N= 10/12) or (R, S) Ncad-YFP-Δp120 showing that the p120 interaction site is not required for reduction in Ecad after Ncad overexpression (N= 15/15, asterisks). Scale bar is as marked. Each experiment was repeated at least 3 times.
