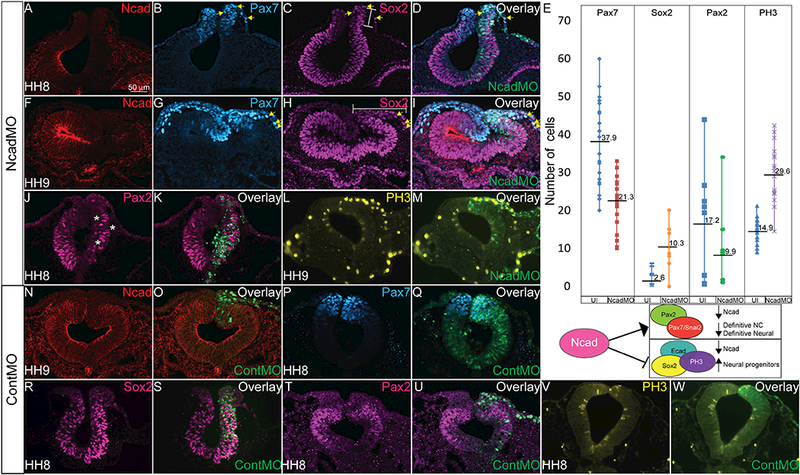
Figure 6. Loss of Ncad affects ectodermal derivative specification.

IHC in an HH8 embryo for (A, F, D, I, N= 35/35) Ncad, (B, G, D, I, N= 38/38) Pax7, and (C, H, D, I, N= 25/47) Sox2 in cells electroporated with NcadMO show decreased expression of Ncad and Pax7 while Sox2 is expanded into the dorsal neural tube and NNE. Bars indicate expanded regions of Sox2 expression. (E) Graph showing actual cell numbers marked by indicated markers in uninjected (UI) and NcadMO-injected embryos. Numbers marked on graph represent average number of cells expressing indicated marker. Diagram below graph shows hypothetical role of Ncad in driving neural cell determination. (J, L) Pax2 expression in NcadMO- injected embryos demonstrates reduction in Pax2 (N= 10/10, asterisks). IHC for (L, M) PH3 expression after NcadMO-electroporation. NcadMO increases the number of PH3 positive cells 2.0 fold as demonstrated by number of PH3 positive cells in uninjected sides of embryos compared with NcadMO (N= 25/25). IHC for (P, Q, N= 15/17) Pax7, (R, S, N= 9/11) Sox2, (T, U, N= 6/9) Pax2 and (V, W, N= 23/23) PH3 in embryos injected with ContMO alone demonstrating specificity of NcadMO phenotypes.
